January 2, 2026
Markets enter 2026 with solid momentum after another broadly positive quarter. While US large cap equities posted a 2.3% gain for the quarter and 17.3% year-to-date, the real story of 2025 was the resurgence of international assets. For the first time in over a decade, international markets decisively trounced their US counterparts, aided by a falling US dollar. Both developed international and emerging markets stocks achieved nearly double the total return of the S&P 500 last year, delivering 32.0% and 34.3% respectively.
Gold also extended its strong run, even as real interest rates and the US dollar moved modestly higher during the quarter. This price action suggests that market participants are hedging against the possibility of the Fed and Treasury using policy tools aimed at limiting the economy’s interest-rate burden (yield curve control).
Banks were another Q4 standout, outperforming the S&P 500. The industry shrugged off an early-quarter scare following the bankruptcy of First Brands, a major auto parts supplier whose default briefly raised concerns about loan book quality. The market’s willingness to swiftly dismiss that episode as idiosyncratic rather than systemic is a constructive signal for risk assets.
Exhibit A: Total Returns by Asset Class

Source: Bloomberg, Fiduciary Trust Company. Indices: Cash: Bloomberg Barclays 1-3M Treasury Note, High-Yield: Bloomberg Barclays US Corp HY, Corporate Debt: Bloomberg Barclays US Corporate ,U.S. Large and Mid Cap: MSCI USA, U.S. Small Cap: MSCI USA Small Cap, Dev. Int’l: MSCI EAFE, Emerg. Mkts: MSCI EM, Municipal Bonds: Bloomberg Quality Intermediate Muni. Data as of December 31, 2025.
The Yield Curve Matters Again—And Banks Responded
A key macro development in Q4 was a steepening of the yield curve, particularly the spread between 10-year and 2-year Treasury yields. The move was driven largely by expectations for additional rate cuts, while longer-term yields were relatively unchanged. For banks, curve shape matters. A steeper curve can improve net interest margins and profitability, and that was reflected in Q4 performance for both large and regional banks.
Exhibit B: Treasury 2 vs. 10-year Spread Relative to US Bank Stocks

Source: Bloomberg, Fiduciary Trust Company. Data as of December 31, 2025.
The Magnificent 7 Is No Longer a Single Trade
One of the clearest shifts in market behavior during the second half of 2025 was rising dispersion within mega-cap technology stocks. From the April lows through the end of the third quarter, the Magnificent 7 traded as a single, highly correlated bet with each member rallying at least 30%. In Q4, that correlation was fractured. While the group was up modestly in Q4, three members posted negative returns. Alphabet (Google) was the clear winner, up 29% in the fourth quarter. A key catalyst for the market’s increased selectivity was Google’s recent AI model release, which was trained on its own custom chips and outperformed ChatGPT on several benchmarks. This raised questions about the durability of Nvidia’s dominance in AI training hardware and shifted the AI narrative from a broad, indiscriminate rally to one that is increasingly viewed as a competitive, zero-sum ecosystem.
AI’s Next Phase: From Adoption to Profit Capture
History suggests that while technology innovation drives broad adoption, economic value almost always consolidates into a duopoly or monopoly. Whether in PC operating systems (Windows and Mac), search (Google), or mobile (iOS and Android), initial ecosystems of many players inevitably collapse into two or three dominant winners that capture the vast majority of the profit pool.
If AI follows this arc, the current field of more than ten major LLM developers will likely shrink to just a few survivors. This consolidation dynamic explains why the market increasingly views the AI arms race as a zero-sum game. If OpenAI wins, it may be at the direct expense of Google’s search monopoly or Meta’s ad dominance. If Google wins using its proprietary TPUs, it proves that hyperscalers can succeed without Nvidia’s hardware, calling into question the pricing power and margins that Nvidia currently commands.
At times during the quarter, investors even questioned the entire AI complex, debating whether AI represents a step-change in productivity or merely a more powerful form of search. That skepticism was reinforced by comments from prominent figures in the field, including Ilya Sutskever, co-founder of OpenAI, and Yann LeCun, Meta’s chief AI scientist. Both made comments suggesting that today’s LLMs are a dead end on the path to true machine intelligence and that simply throwing more computing power at LLMs is yielding diminishing returns.
This debate will face a critical test with the release of the first models trained on Nvidia’s next-generation Blackwell GPUs, expected around mid-2026. These chips offer a massive leap in performance per watt, theoretically enabling models that are orders of magnitude more capable than the latest ChatGPT or Google Gemini. If these models demonstrate a meaningful step-function improvement over current capabilities, investor confidence in the AI trade is likely to reaccelerate. If improvements prove only incremental, enthusiasm and valuations may plateau.
Sizing the Prize: Labor Economics at the Center
If the AI trade is indeed becoming a zero-sum battle for dominance, what is the prize they are fighting for? The answer lies in the single largest expense line on the global corporate income statement: labor.
For decades, labor costs as a percentage of business output held steady at roughly 62%. Since the 1990s, that figure has drifted down to the mid-50s. A key question for 2026 and beyond is whether AI can accelerate that decline.
Exhibit C: Labor Costs as a Percentage of Business Output
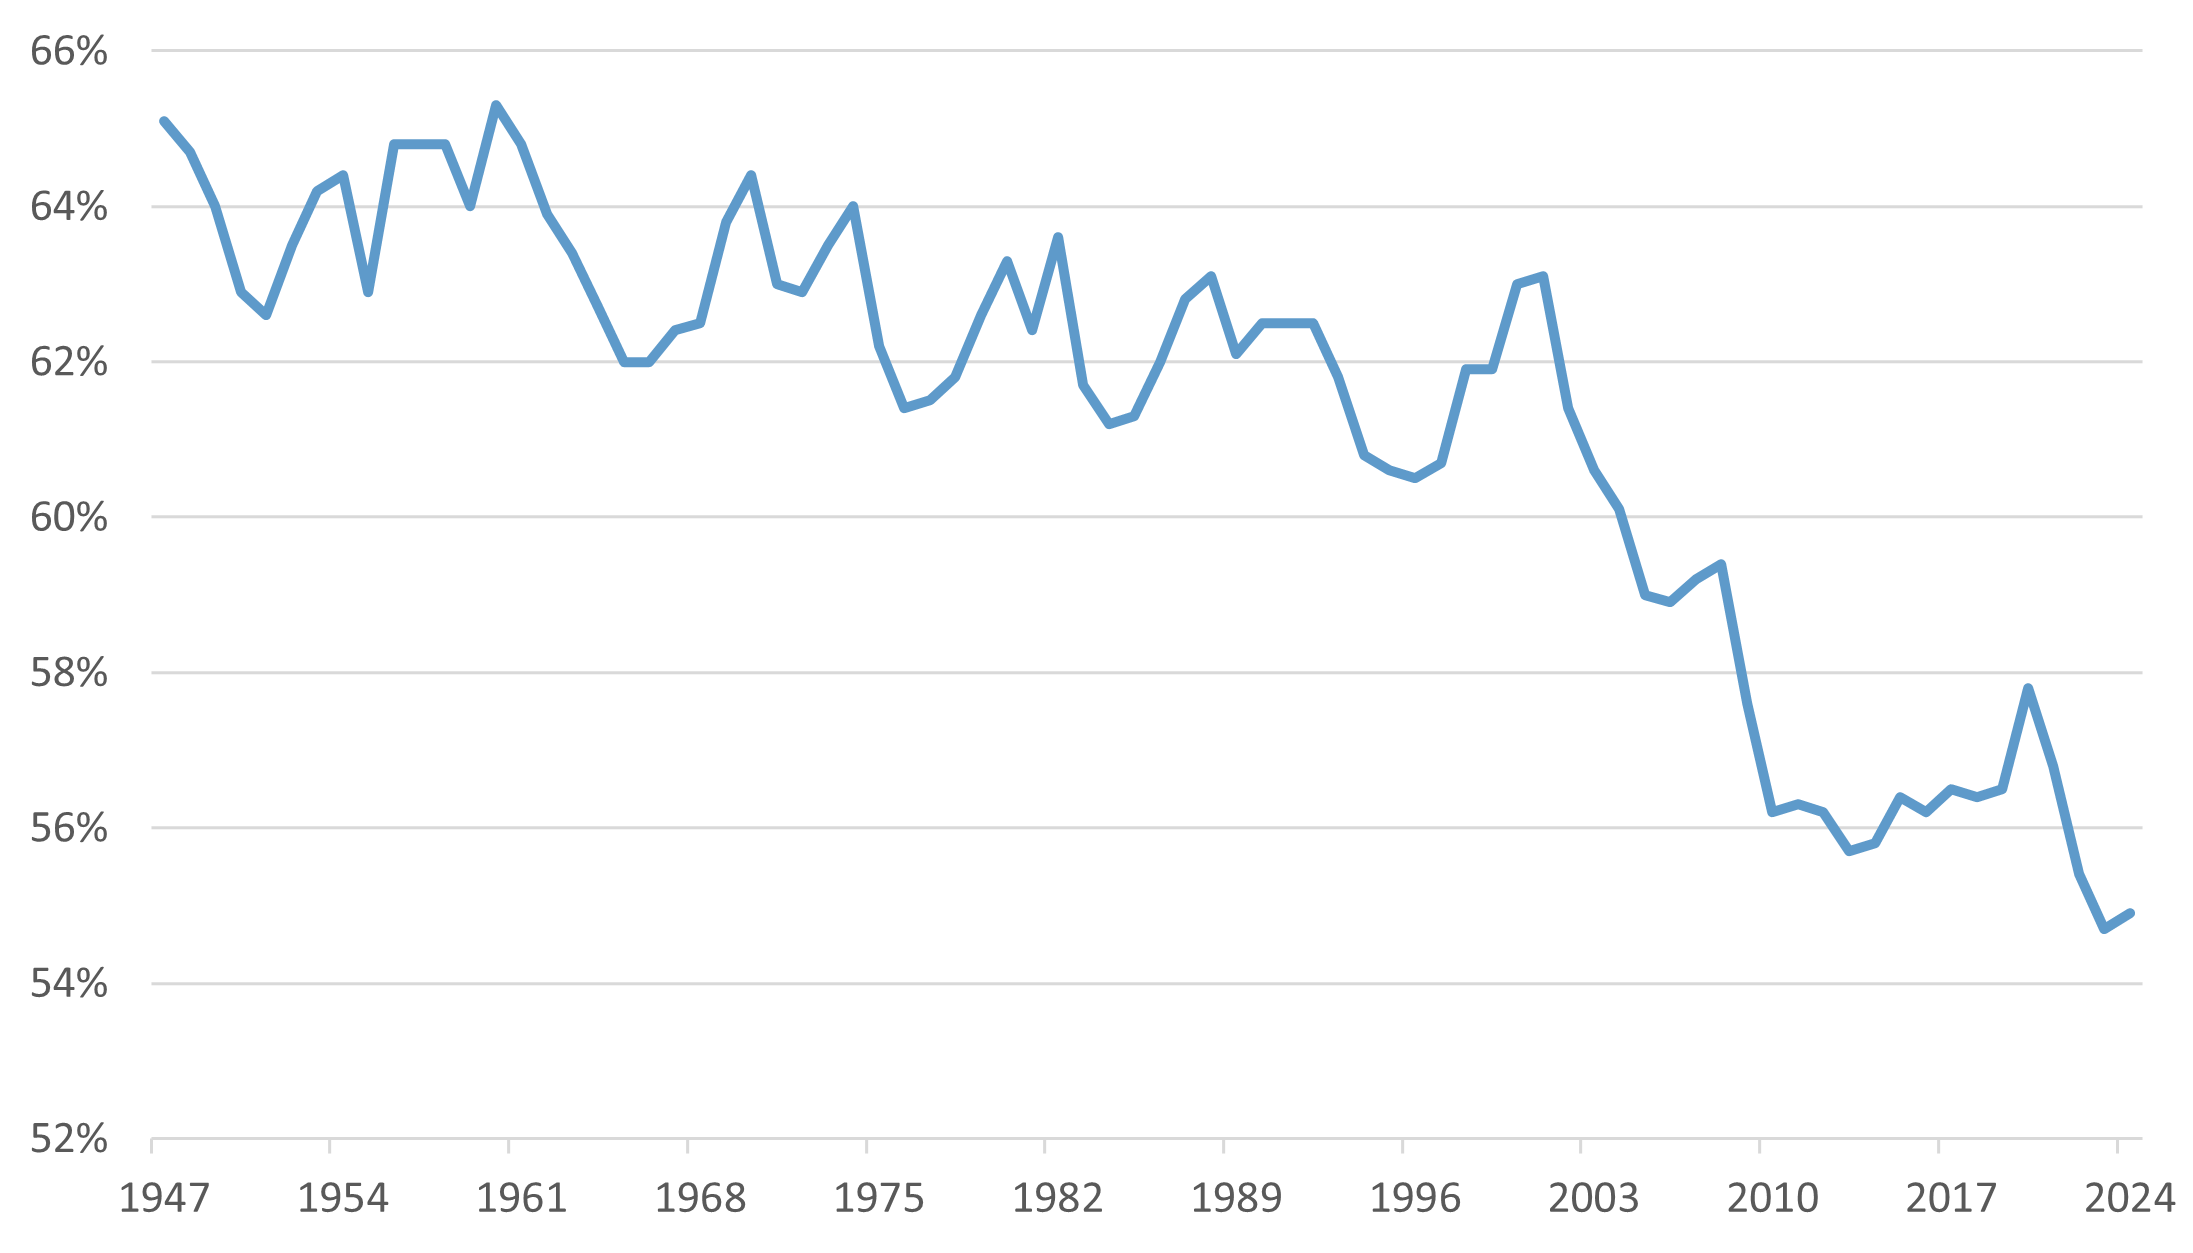
Source: Bureau of Labor Statistics, Fiduciary Trust Company. Data as of December 29, 2025.
One widely cited analysis from BlackRock suggests that if AI can permanently reduce labor costs by just 5%, it would unlock approximately $32 trillion in present value profits for the corporations deploying the technology and about $8 trillion in present value revenue for AI service providers. Those estimates are directionally consistent with other long-run AI spending analyses. The market’s challenge is that since the launch of ChatGPT, the market capitalization of the AI complex has already surged by nearly $20 trillion.
Investors must therefore confront a difficult reality: if multi-trillion-dollar benefit estimates are even roughly correct, a meaningful share of expected value is already embedded in current valuations.
Exhibit D: Change in Market Cap from Nov 30, 2022 to Nov 14, 2025

Source: Blackrock, Goldman Sachs, Fiduciary Trust Company. GS TMT refers to Goldman Sachs Technology, Media and Telecom Group. Data as of December 29, 2025.
Labor Market Signals to Watch
If AI delivers on its promise of labor efficiency, the adjustment will inevitably show up in the labor market.
AI may influence the labor market not only through layoffs, but by limiting job creation altogether. That dynamic appears most clearly at the entry level, where unemployment among 20–24-year-olds with a bachelor’s degree remains under pressure. Early-career hiring often serves as a leading indicator as firms adjust workflows before broader labor market impacts emerge.
The Fed’s Dot Plot Reflects the Same Uncertainty Investors Feel
The rise of AI has introduced a new layer of complexity into the Federal Reserve’s policy calculus. If AI ultimately delivers the productivity gains and labor displacement that many expect, the resulting disinflationary impulse would argue for lower policy rates. However, in the near term, easing financial conditions risks reigniting asset prices, potentially undoing some of the progress the Fed has made on inflation. After misjudging inflation’s persistence earlier in the cycle, policymakers are acutely sensitive to the risk of easing too soon, especially given the uncertainty around the timing and magnitude of AI-driven productivity gains, if they materialize at all.
These tensions are increasingly visible in the Fed’s own projections. The December dot plot reveals a divided committee: while the median participant projects just one rate cut in 2026, a growing faction is more focused on downside risks to the labor market. Markets, meanwhile, are pricing roughly two cuts this year. That may seem surprising given President Trump’s stated preference for lower rates and his upcoming appointment of a new Fed chair in May. But monetary policy is not set unilaterally. The federal funds rate is determined by the twelve-member FOMC, where the chair’s vote carries no more formal weight than any other. While a new chair is likely to align with the administration’s preferences, translating those preferences into policy will require persuading the broader committee.
Tariffs, Deficits, and Housing: Policy’s Second-Order Effects
As we begin 2026, markets must digest a flurry of consequential events. The president is expected to name a nominee for the next Federal Reserve chair, while the Supreme Court is scheduled to hear oral arguments related to the administration’s effort to remove Fed Governor Lisa Cook. Beyond the Fed, the Supreme Court is also expected to rule in January on the administration’s use of the International Emergency Economic Powers Act (IEEPA) to impose broad-based tariffs. Lower courts have repeatedly ruled against the White House, and consensus expectations are that the court will ultimately invalidate the IEEPA-based tariffs.
If IEEPA authority is revoked, the president could pivot to Section 122 of the Trade Act of 1974, which allows for temporary tariffs of up to 15% on imports from any country for up to 150 days. That window would provide time to initiate Section 301 investigations aimed at implementing more permanent trade measures. After a period of volatility, the effective US tariff rate was at 10.7% as of September, and tariff revenue is currently running roughly $200 billion above last year’s level. While widely unpopular with corporations and consumers, tariffs have become a meaningful source of federal revenue. A rollback of tariffs could support margins and ease price pressures, but it could also reignite concerns about the deficit, potentially placing upward pressure on longer-dated Treasury yields. In that scenario, we would expect both the Fed and the Treasury to lean aggressively against a sustained rise in rates.
Exhibit E: US Effective Tariff Rate, 1900 – 2025

Source: Bloomberg, Fiduciary Trust Company. Latest data available as of December 31, 2025.
While the administration’s push for lower interest rates would reduce the government’s growing interest burden, it would also help address the more politically urgent problem of housing affordability.
Affordability remains near multi-decade lows, leaving many households, particularly younger families, effectively priced out of homeownership. That reality is likely to remain politically salient heading into the midterm elections. Proposals floated late this year, such as 50-year or portable mortgages, were quickly dismissed as ineffective, underscoring that housing has no easy fix without meaningfully lower rates or a sustained increase in supply.
While households wait for relief on their mortgages, fiscal stimulus in the form of tax refunds represents a more immediate and quantifiable support for growth in early 2026. Because the household tax relief in the 2025 One Big Beautiful Bill Act (OBBBA) was structured as deductions (e.g., no tax on tips/overtime) rather than marginal tax rate cuts, the benefit did not show up immediately in weekly paychecks. Instead, it will arrive all at once.
Strategas Research Partners estimates that consumers will receive roughly $150 billion in incremental refunds this filing season, with total federal tax refunds projected to surge 44% year over year to nearly $520 billion. We expect this influx of liquidity to hit the economy between February and April, likely driving a near-term re-acceleration in consumption, and providing a lift to consumer sentiment, which has languished near historic lows despite record stock prices.
International Equities: Policy Catalysts and Currency Tailwinds
International equities decisively outperformed the S&P 500 in 2025 for the first time in more than a decade. We believe this rotation has legs. As US valuations stretch toward perfection, international markets offer a compelling valuation hedge with distinct policy catalysts that are uncorrelated to the US cycle.
The strongest tailwind for non-US assets may actually come from the US Treasury and Fed. If the administration attempts to contain long-term borrowing costs through explicit or implicit yield curve control, the result will be artificially suppressed real yields, and further downward pressure on the dollar.
Policy dynamics abroad are also turning more supportive. Germany is expected to ramp fiscal spending after years of restraint, with the government mobilizing its €500 billion infrastructure fund and committing to raising defense and security spending to 5% of GDP over the next decade. Japan enacted a ¥21.3 trillion ($135 billion) stimulus package, its largest since the pandemic, aimed at sustaining domestic growth. South Korea has launched a “corporate value-up” initiative designed to address the long-standing Korea discount by improving governance, capital efficiency, and shareholder returns. Collectively, these measures mark a notable shift toward more shareholder-friendly and growth-supportive policy outside the US.
International markets may also offer a more attractively priced entry point to the AI theme. For example, as AI transitions to the inference phase (running the models), it becomes far more memory-intensive than the training phase. This creates a durable tailwind for high-bandwidth memory suppliers. Two of the most important beneficiaries of this dynamic, Samsung Electronics and SK Hynix, are based in South Korea and trade at less than 10x expected 2026 earnings, highlighting how global equity markets can provide differentiated exposure to AI at valuations that remain meaningfully below US peers.
Portfolio Considerations
We enter the new year with three key considerations in our positioning:
First, within US equities, we believe banks remain well positioned to benefit from a steepening yield curve. As policy rates move closer to neutral, improving net interest margins alongside a more supportive regulatory environment provide a solid fundamental backdrop.
We have largely avoided attempting to identify individual winners within the AI trade. History suggests profit capture tends to be concentrated, and we believe maintaining broad exposure increases the likelihood that the eventual winners will more than offset exposure to the losers.
Second, clear catalysts remain intact for developed international equities. With distinct fiscal tailwinds in Germany and Japan, and a re-rating underway in South Korea, we believe an overweight to international equities offers an attractive hedge against a potentially weaker US dollar and stretched domestic valuations.
Third, we favor extending duration in municipal bond portfolios relative to an intermediate benchmark. We believe that the administration will do everything in its power to suppress long-term yields to manage federal interest expenses and increase housing affordability. The long end of the muni yield curve remains attractively valued relative to Treasuries.
If you have questions about how these themes may affect your portfolio, please contact your Fiduciary Trust Investment Officer or Sid Queler at queler@fiduciary-trust.com.
Exhibit F: Fiduciary Trust Asset Class Perspectives

Note: These forward-looking statements are as of 1/2/2026 and based on judgements and assumptions that change over time. Tactical allocation denotes positioning relative to a strategic benchmark. Recent Change column signals whether the recommended allocation to the asset class increased, decreased, or was unchanged in the last calendar quarter. Allocation denotes the percentage weight in a portfolio assuming a 60% equity, 35% fixed income, 5% cash benchmark.