

As a child, I grew up without a television, which I consider a blessing to this day. Every year however, my family would drive to France for the summer. There, most of my friends had TVs and we would regularly watch reruns of old American television series. One of our favorites was “L’Homme qui valait trois milliards”, a.k.a. “The Six Million Dollar Man.” In the show, Colonel Steve Austin receives bionic implants, an arm, two legs, and an eye, giving him superhuman powers at a cost of six million dollars, surely an amount only the CIA could afford at the time. Even Hollywood sci-fi writers could not imagine that a few decades later, they would have been able to give Colonel Austin a new artificial brain, albeit at a cost of several hundred billion dollars.
It would cost much more than several hundred billion dollars, in fact. As far as artificial intelligence is concerned, the world seems to be spending like there is no tomorrow. And indeed, several prominent AI safety researchers have recently warned that there might not be any tomorrow, voicing concerns about advanced AI and the risks it could pose to humanity over the coming decade.
However, as the saying goes, there are no rich pessimists. From an investment perspective, we will remain positive and optimistic on AI, with the belief that on balance, innovation will continue to be a force for good. As companies integrate AI into their operations and adoption broadens across industries, we believe that the technology will ultimately support a productivity boom and enable the economy to grow at a structurally higher rate.
This is certainly the view of many investors, as the stock market, and to some extent the US economy, have become a giant bet on the promise of AI. Excitement over this new technology is overriding some of the fears related to the wars in the Middle East and Ukraine, although these wars are adding to inflationary pressures.
In our opinion, inflation, and its potential impact on interest rates and the cost of capital, remain the key risk threatening the ongoing AI bull market.
We now discuss all these factors, starting with our economic outlook.
The Economy
The arguments that we put forward in our Q3 quarterly outlook letter remain valid. We remain confident that the US economy is on solid footing based on nearly full employment, strong corporate profits, and a high (and growing) level of capital investments. Higher energy prices have been a drag on consumer spending, in particular at the lower level of the income scale, but overall consumption remains strong.
In the words of the Federal Reserve, economic activity is “expanding at a solid pace,” “productivity growth is strong,” “capital investment is robust,” and job gains have “kept pace with the workforce.”
The labor market is solid. The most recent labor data remains strong across the board, with the unemployment rate holding near 4.1%. The economy is essentially running close to full employment.
AI has had little negative impact on employment so far, despite initial fears of massive job losses. While hiring may have slowed in a few segments very exposed to AI, there has not been a meaningful effect across the broader economy.
A healthy level of employment represents a reassuring potential cushion against a negative change in our economic outlook.
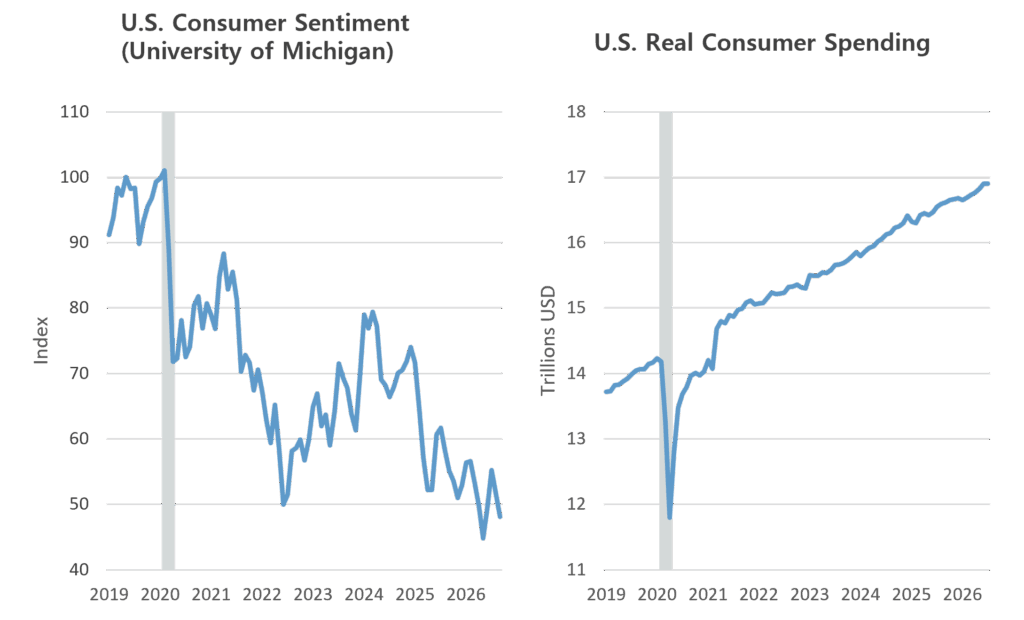
Consumption remains strong, for now. As long as consumers have jobs and steady incomes, they generally continue to spend. Core retail sales rose 1.4% in August, well above expectations across a broad range of categories. This strength shows that even if interest rates continue to rise, the economy should be able to handle higher borrowing costs.
As we pointed out last quarter, the economy continues to be divided between lower- and higher-income consumers. Consumer sentiment has weakened across every group — including different age groups, political affiliations, races, and genders — but the decline has been deeper and more sustained among lower-income households. These consumers are likely more pessimistic about the economy because they are facing greater cost-of-living pressures.
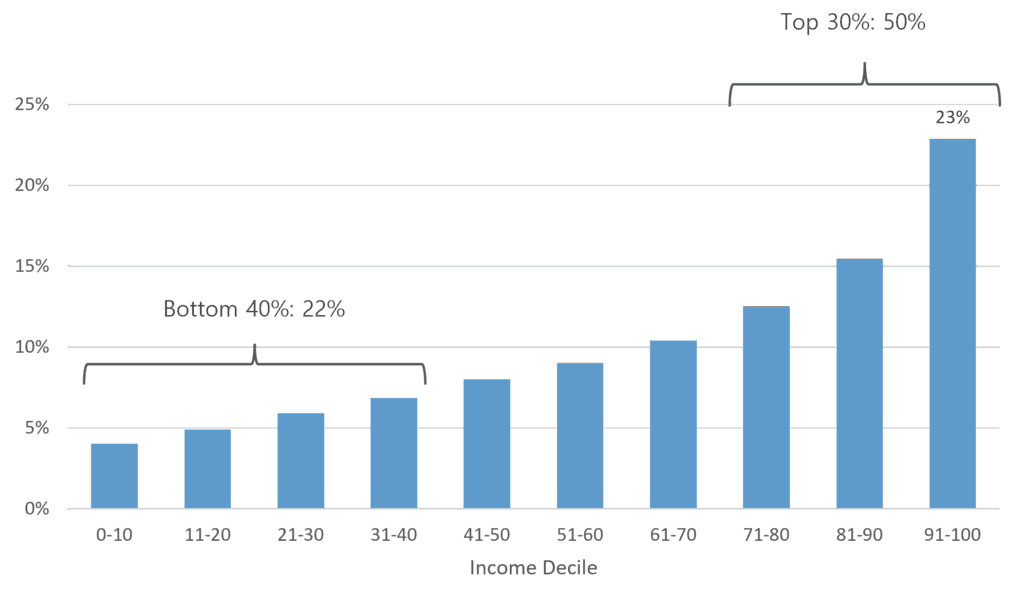
Households at the bottom of the pay scale are feeling the impact of higher everyday expenses most acutely, although they account for only a small share of total consumer spending. In fact, the top 10% of income earners account for 23% of US consumer spending, slightly more than the bottom 40% of income earners.
Exhibit A: Share of Total Annual Expenditures by Personal Income Decile
Source: Federal Reserve Bank of St. Louis, U.S. Bureau of Labor Statistics, Fiduciary Trust Company. Data as of September 28, 2026.
The bottom line is that American consumers, overall, have not cut back on nonessential spending. If household budgets were under serious pressure, we would expect to see it in the data. Instead, most people are spending a larger share of their income, maybe because rising stock prices make them feel wealthier.
We still expect consumer spending to soften in the coming quarters due to slow nominal wage growth and higher energy prices but for now, consumption is still a key driver of the US economy.
Exhibit B: Consumer Sentiment and Spending
Source: Bloomberg, University of Michigan, Bureau of Economic Analysis, Fiduciary Trust Company. U.S. consumer sentiment data represents the University of Michigan Consumer Sentiment Index. U.S. real consumer spending represents seasonally adjusted real personal consumption expenditures. Data as of September 25, 2026.
We are enjoying an enormous investment cycle. The current AI-driven investment boom is unfolding on a massive scale. Capital expenditures by hyperscalers and semiconductor companies continue to accelerate, while governments around the world are increasing borrowing to expand defense capabilities, strengthen energy security and upgrade critical infrastructure.
Taken together, these public- and private-sector investments are creating a capital expenditure “supercycle.” The benefits are spreading well beyond technology and improving our growth outlook for many traditional industries.
Investors will probably revisit questions about AI spending efficiency and return on investment every earnings season as they analyze corporate guidance and capital allocation decisions. That kind of skepticism is healthy. In fact, we should start to worry when investors stop questioning AI investments altogether, because that would point to growing complacency. This is not the case today.
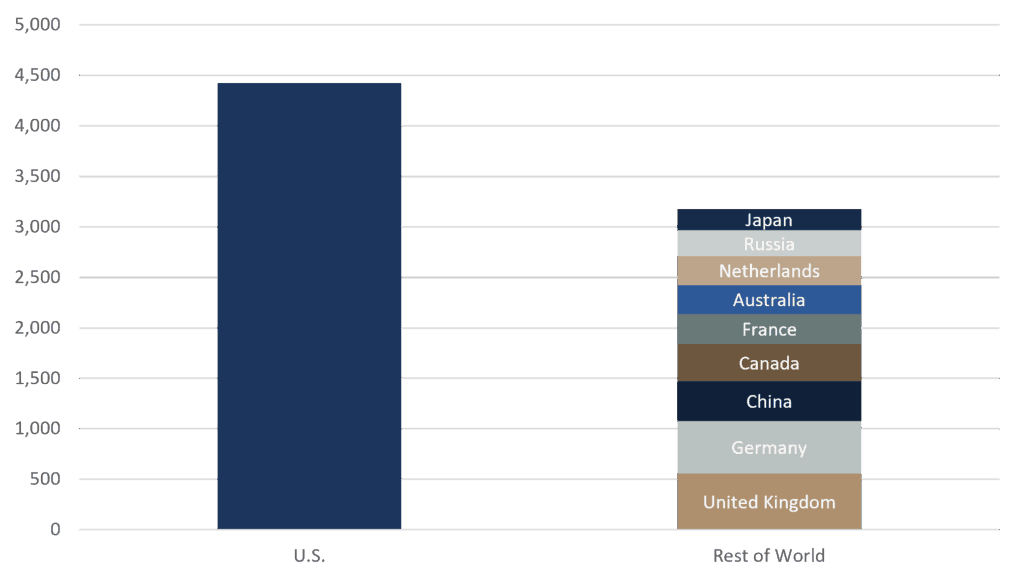
This investment wave into AI is global, but the United States is still the clear leader. It spends more on data centers than any other country and continues to lead the way in building AI infrastructure.
Exhibit C: Number of Data Centers, U.S. vs. Rest of World
Source: Strategas, Statista, Fiduciary Trust Company. Data as of September 25, 2026.
Corporate profits are very strong. Corporate profits, as measured by the S&P 500 earnings per share, grew by 51% year-on-year in Q2 and by 26% year-on-year for the past four quarters.
This level of corporate profits is extraordinarily high, more in line with what one would expect when exiting a recession. In fact, during the last 30 years, the recent pace of earnings growth has been exceeded only during the post-recession rebounds in 2010 and 2021.
It is hard to imagine that we would be at the start of a recession in these conditions. Events in the Middle-East or Ukraine may change our outlook, but as we stand, we are confident in the health of the economy.
The Markets
The major drivers of the equity bull market are still in place, including the most important: earnings growth.
Earnings are still driving global equities. The bulk of equity returns across regions over the past year have been driven by strong earnings growth, rather than by an increase in valuation multiples.
In fact, in the United States, Asia, and emerging markets, valuation multiples have declined, while Japan and Europe have seen modest valuation increases. This is an important change from previous periods: earnings are now the key driver of returns, not rising valuations or declining interest rates.
Earnings have been strong, but estimates have also continued to move higher, giving equity markets solid fundamental support. The biggest upward revisions have been concentrated in industries tied to AI capital spending and energy, while a few other industries have benefited from higher tax refunds.
Looking forward, according to consensus, S&P 500 earnings will grow by 32% during the full year of 2026 and by 14% in 2027. We note that this forecast is dependent on energy prices and interest rates but most importantly, on continued spending on AI. Earnings of companies outside of the United States are expected to grow at an even faster pace of 14.7% in 2027.
Exhibit D: MSCI All World Country Index – EPS Consensus Estimates

Source: Bloomberg, Fiduciary Trust Company. Data as of September 30, 2026.
Valuations are high, but they do not predict an imminent correction. The S&P 500 price to forward earnings ratio has declined from 23x a year ago to 19x. While this valuation multiple is in line with the 10-year average, it remains expensive compared with longer-term averages on almost any measurement basis (trailing P/E, forward P/E, EV/Sales, EV/EBITDA, Price/Book, Price/Sales, etc.). Goldman Sachs also noted that in the past several decades, the market multiple on trend earnings has only been exceeded during the peak of the dot-com bubble.
We know that valuation multiples can help set expectations for returns over the long run. However, we also note that they are not useful for timing a correction or calling the end of a bull market.
Exhibit E: Current Percentile Ranking Relative to History

Source: Bloomberg, Fiduciary Trust Company. Includes monthly data from January 1, 1993 to September 30, 2026.
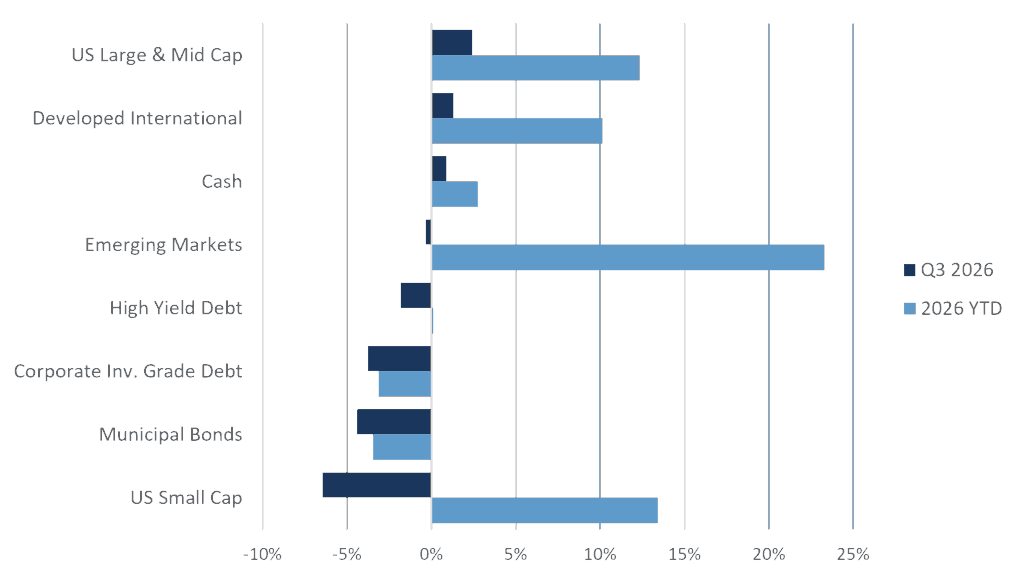
Exhibit F: Total Returns by Asset Class
Source: Bloomberg, Fiduciary Trust Company. Indices: Cash: Bloomberg Barclays 1-3M Treasury Note, High-Yield: Bloomberg Barclays US Corp HY, Corporate Debt: Bloomberg Barclays US Corporate ,U.S. Large and Mid Cap: MSCI USA, U.S. Small Cap: MSCI USA Small Cap, Dev. Int’l: MSCI World Ex. USA, Emerg. Mkts: MSCI EM, Municipal Bonds: Bloomberg Quality Intermediate Muni. Data as of September 30, 2026.
Outlook And Risks
So, what are we worried about?
We believe that inflation, and its potential impact on interest rates and the cost of capital, remains the key threat to the ongoing bull market. With AI driving earnings, and earnings fueling the rise in equities, it is also important that we monitor the speed and sustainability of AI deployment, and how capital expenditures are turning into revenue and earnings for AI companies.
Inflation and the rate increase cycle. Renewed tensions in the Middle East have pushed up crude oil and refined-product prices, with diesel and jet fuel back at their 2022 highs. The concern is that once oil inventories run down, energy prices could keep climbing, pushing inflation higher and forcing the Federal Reserve to raise rates. In fact, in September, the 10-year Treasury yield broke through the 5% level to hit its highest level in nearly twenty years, and the Federal Reserve raised rates for the first time in three years. Markets are now pricing in three more increases by the middle of next year.
A continued rise in rates would represent a headwind for equity markets. However, Goldman Sachs research has shown that equity corrections are caused more often by changes in long-term yields than short-term rates, with the pace of rate increases typically mattering more than the level of rates.
This is in line with research work by Strategas, which showed that early rate hikes may not immediately derail stocks. Historically, markets have often continued rising through several increases. The greater danger emerges when persistent inflation convinces investors that rates will stay higher for longer, causing long-term yields to climb rapidly even as stock prices remain elevated. In past episodes such as 1987 and 1999–2000, this combination preceded major market declines.
This is a risk we will continue to monitor.
The speed and sustainability of AI deployment. The AI investment boom is driving nearly half of the S&P 500 earnings growth in 2026 and yet, there are many reasons to question the speed and sustainability of AI deployment. For example, the availability and cost of power, most notably electricity, which some view as the main bottleneck for data center deployment; or the political opposition to data centers, which has recently led to high-profile state moratoriums. We believe that these issues may slow down AI deployment but will not prevent it in the long run.
Several AI companies have also talked about “pacing their development” so they can put stronger safety guidelines in place. However, competition across the industry remains intense, and the rivalry between the United States and China adds to the pressure. As a result, it seems unlikely that leading US firms will agree to slow their work on frontier AI, or that the federal government will impose significant restrictions on it.
Some have also questioned the availability and cost of capital, given that AI firms are increasingly funding capital expenditures by issuing debt in a rising rate environment. The key issue, of course, will be the ability of AI firms to generate revenue and cash flows in line with the capital expenditures incurred.
These are all risks that we will monitor, but in our opinion, they are unlikely to derail the AI deployment boom.
Concerns about companies “over-earning.” The recent strength of S&P 500 earnings growth has raised investor concerns that the market is in an “earnings bubble,” driven not only by very large AI capex spending but also by earnings from private investment gains and extraordinarily-high semiconductor margins.
We do believe it is the case that earnings are being inflated by rising private equity investment values. According to consensus, in Q2 2026, unrealized gains on private-company investments of Alphabet, Amazon and Microsoft — reported as “other income” in GAAP earnings statements — totaled roughly $150 billion, equal to 12% of S&P 500 earnings.
Put simply, the rise in private equity valuations is helping fuel the rise in the stock market. However, if one were to exclude the “other income” inflating this year’s earnings, next year’s growth rate would look even more attractive, increasing to 18% from 11%.
Exhibit G: Mega-Cap Tech “Other Income”
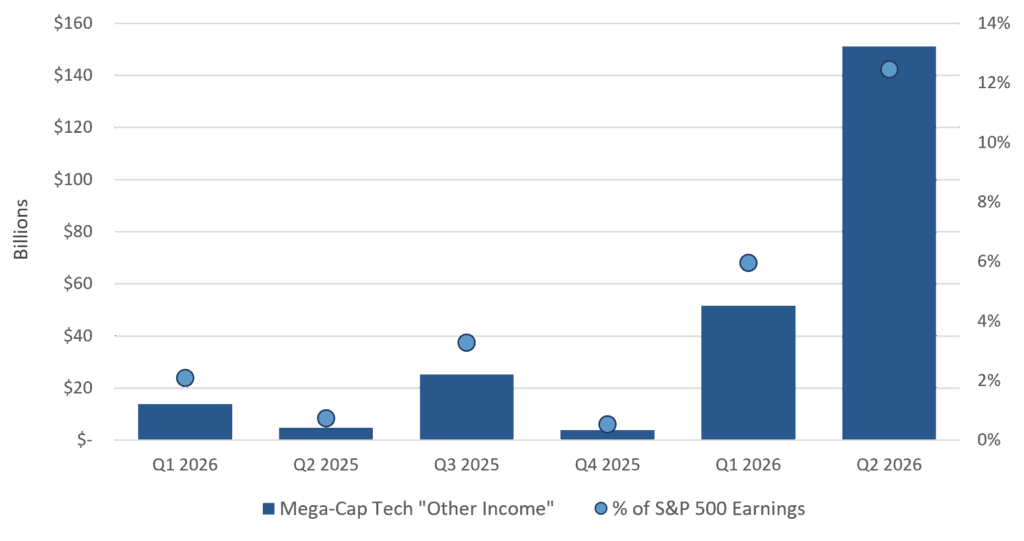
Source: Bloomberg, Fiduciary Trust Company. Mega-cap tech includes Alphabet (GOOGL), Amazon (AMZN), and Microsoft (MSFT). S&P 500 earnings is calculated using S&P 500 total net income figures computed bottom-up from Bloomberg constituent-level data. Other income is calculated on an after-tax basis using tax-rates for each company during the reporting period.
Another concern is whether today’s semiconductor profit margins can last, since they have helped push S&P 500 earnings growth above trend. Strong demand and limited supply have lifted semiconductor prices, and S&P 500 memory companies are now earning gross margins of roughly 80% — more than double their historical average and the highest level in decades.
History suggests that margins rarely keep rising this quickly when profit shares are already elevated, so margins will likely contribute less to earnings growth going forward. Analysts already expect this, forecasting that margins will return to their historical levels within the next 18 months. The fact that the market is aware gives us comfort that this will not become a significant issue.
As the boost from AI investment spending starts to fade, the S&P 500’s profitability will increasingly depend on whether companies can turn AI adoption into real productivity gains, just like the benefits of the internet eventually accrued to a broad range of industries rather than just the early technology providers. We should have a clearer sense of how AI is affecting the economy over the next few quarters.
What Does It All Mean for Us?
Taking it all together, we are still comfortable with the market’s direction. However, with inflation becoming a real concern and interest rates rising, we believe that it is prudent to rebalance portfolios after the strong performance of equities, and if necessary, move from an overweight equity position to a more neutral position.
With AI-related companies driving the bulk of the earnings fueling the stock market, we also believe that it is important to consider investment strategies offering differentiated sources of return, both to compound capital and to stabilize portfolios. We are currently exploring several strategies that can deliver equity-like returns in segments that are tied to a different set of economic drivers than AI and offer low correlations to the stock and bond markets. We believe that these will give our investment officers a larger set of tools to build portfolios that are better positioned for a variety of environments.
Final Words
We close this letter with a few comments that we trust will stand the test of time:
- Patience is key. Time in the market is more important than market timing.
- Asset allocation will be the main driver of your returns. Trying to enhance returns by trading individual securities or sectors is very hard. As markets gyrate from one sector to another, remember that asset allocation will have the highest impact on the performance of your portfolio.
- Portfolio construction matters. Exposure to various asset classes and investment strategies should match your investor profile, liquidity needs, tolerance for volatility, tax situation, and time horizon.
- Diversification is your friend. Thoughtfully combining strategies that do not move in lockstep, and introducing strategies that exhibit very low correlation to traditional asset classes, will reduce the volatility of your portfolio across a variety of environments.
If you would like to discuss how these factors may influence your investment portfolio, please reach out to your Fiduciary Trust investment officer or Sid Queler at queler@fiduciary-trust.com.
Exhibit H: Fiduciary Trust Asset Class Perspectives

Source: Fiduciary Trust Company. These forward-looking statements are as of October 1, 2026 and based on judgements and assumptions that change over time. Tactical allocation denotes current positioning relative to a strategic benchmark. Allocation denotes the percentage weight in a portfolio assuming a 60% equity, 35% fixed income, 5% cash benchmark.


