
Key Takeaways
- The US economy appears to rest on relatively solid economic foundations.
- AI is powering earnings and earnings – not multiples – are driving the markets. In turn, the equity rally seems sustainable.
- However, in the short term, inflation could derail this scenario by pushing yields too high and compressing multiples. Thus, caution remains warranted.
- There are a number of long-term issues that are worth considering, such as the trajectory of AI spending, the liquidity environment, and the long-term impact of the Iran war.
- Most importantly, we may be entering a new investment environment, more inflation-prone, with significant implications for portfolio management. This will be covered in another paper.
- In the meantime, we recommend that investors remain patient, focus on overall asset allocation, and maintain a diversified mix of asset classes and strategies aligned with their liquidity needs, risk tolerance, and time horizon.
1. The Macro Backdrop: A Bifurcated yet Resilient US Economy
The US economy has absorbed multiple shocks in the past twelve months, including trade wars and a real war in the Middle East, but it remains relatively robust:
- Capital expenditures are very strong, driven by massive AI-related investments.
- Corporate profitability is very high, with S&P 500 operating margins around 17% for Q1 2026, and a forecast of 20% for Q2 2027, an all‑time high. In the first quarter, companies delivered year-over-year growth of 28%, with 84% of them beating expectations, a breadth normally associated with post‑crisis recoveries.
- Labor markets are resilient, with unemployment steady at 4.3%. In May, payrolls posted strong gains for the third month in a row and beat expectations. For now, the war in Iran and the deployment of AI does not seem to be affecting the overall health of the labor market.
Consumer spending represents more than two thirds of the US economy. It has remained strong despite the impact of tariffs, higher energy prices, slowing wage growth, and a decline in government assistance programs. Several economists have pointed out that consumption is increasingly bifurcated. Higher-income households that benefit from strong equity markets are generating the bulk of demand, while lower-income households are suffering from a sharp drop in their real disposable income. While real consumption could still slow down at some point, it remains resilient so far.
For now, the US economy appears to rest on relatively solid economic foundations. This economic strength extends to the rest of the world. Goldman Sachs estimates that global economic growth will be around 2.4% in 2026 and reach 2.8% in 2027.
2. Corporate Health: Earnings‑Driven Strength, Powered by AI
So far in 2026, strong earnings growth has been the principal driver of global stock market gains. Goldman Sachs estimates that in 2026, earnings in developed markets will grow at more than 20% and at more than 60% in emerging markets.
In the US, all but one of the 11 index sectors reported positive year-over-year earnings growth in the first quarter. With earnings growth projected at 23% for 2026 and 15% for 2027, the fundamental foundation for the US equity markets remains strong.
Exhibit A: Total Returns by Asset Class
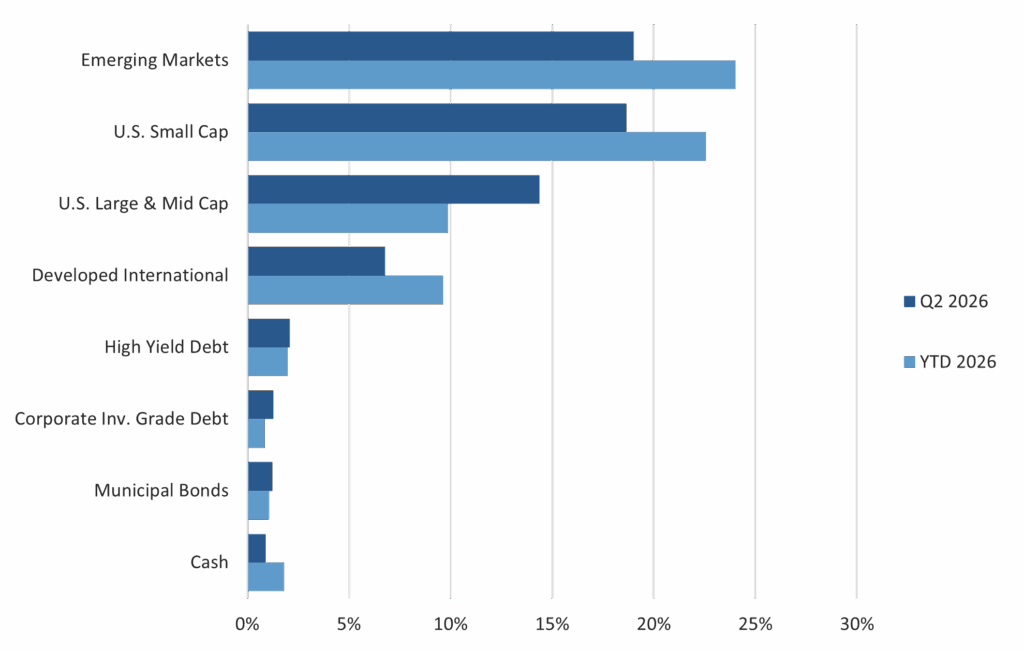
Source: Bloomberg, Fiduciary Trust Company. Indices: Cash: Bloomberg Barclays 1-3M Treasury Note, High-Yield: Bloomberg Barclays US Corp HY, Corporate Debt: Bloomberg Barclays US Corporate ,U.S. Large and Mid Cap: MSCI USA, U.S. Small Cap: MSCI USA Small Cap, Dev. Int’l: MSCI World Ex. USA, Emerg. Mkts: MSCI EM, Municipal Bonds: Bloomberg Quality Intermediate Muni. Data as of June 30, 2026.
Exhibit B: S&P 500 Earnings per Share Estimate Progression for 2025-27

Source: Bloomberg, Fiduciary Trust Company. Data as of June 16, 2026.
Crucially, the US market’s advance has not been driven by multiple expansion. The forward price/earnings multiple for the S&P 500 has declined this year, which strengthens the broader bullish thesis and supports expectations for further upside.
Exhibit C: S&P 500 Forward Price to Earnings Ratio
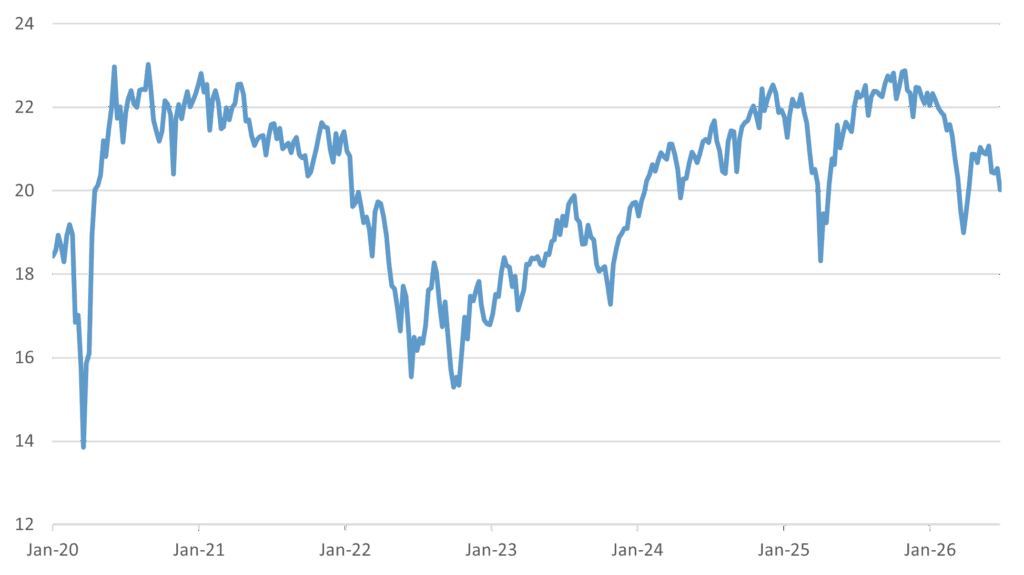
Source: Bloomberg, Fiduciary Trust Company. Data as of June 26, 2026.
AI has been a key contributor to the growth in US earnings, acting through several channels:
- A surge in capital expenditure. US construction firms and power supply and distribution companies are seeing meaningful gains from the build-up of data centers, even if most of the high-value equipment – GPUs, memory chips, power supply and cooling systems – is imported from Taiwan, South Korea and Japan. This investment phase has room to continue because of the long-term nature of the AI infrastructure demand cycle, which represents a structural capital expenditure (“capex”) commitment with multi-year visibility. Importantly, the US corporate sector has yet to see any deterioration in the real rate of return on invested capital. As shown below, overall corporate return on capital is stable and at a record-high level, unlike during the period of overinvestment in telecom infrastructure before the dot-com crash in 2000.
Exhibit D: S&P 500 Return on Capital
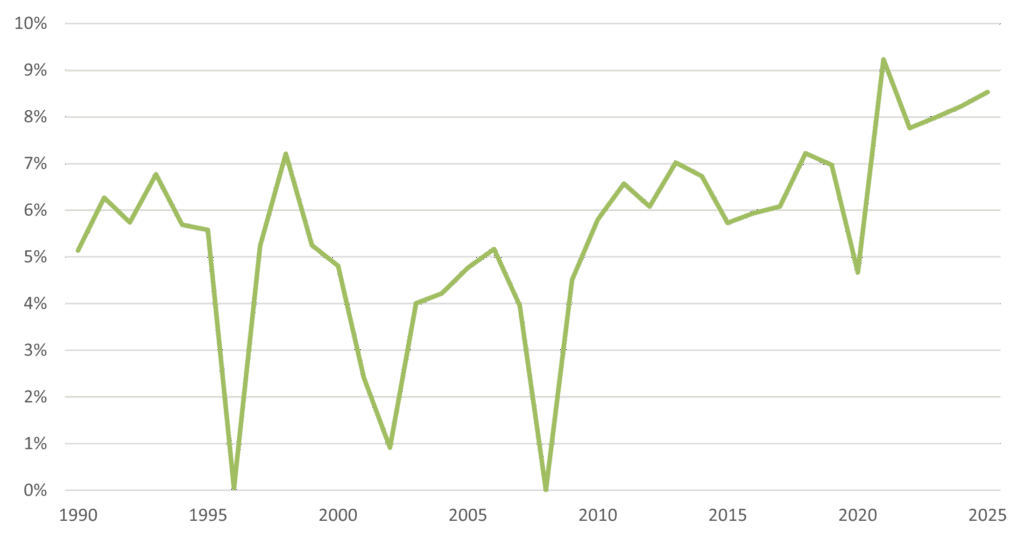
Source: Bloomberg, Fiduciary Trust Company. Return on Capital measures the return that an investment generates for capital contributors (combined debt and equity), in percentage.
It indicates how effective a company is turning capital into profits. Data as of June 26, 2026.
- Productivity gains linked to AI adoption. AI is reducing the labor and capital required to produce a given unit of output. This is a structural driver of margin expansion that is not dependent on demand. In turn, US labor productivity has risen in 13 of the 14 quarters since the November 2022 launch of ChatGPT, with the service sector contributing most of the improvement. This dynamic provides strong support to corporate margins.
- The wealth effect. AI excitement has helped push stock prices higher, which in turn boosts US consumption through the wealth effect. This consumption is driven by stock market gains, and therefore by higher-income households. This makes consumption fragile and subject to the health of the stock market, but for now, it nevertheless continues to fuel earnings growth.
Several economists have pointed out that the US budget deficit has played a central role in driving corporate earnings over the past two decades. As the tax cuts and spending measures in the One Big Beautiful Bill Act phase in, the deficit is expected to widen in 2026. Additionally, the Supreme Court’s decision to strike down President Trump’s “reciprocal” tariffs, combined with higher defense spending tied to the Iran conflict, is likely to push the deficit even higher than it would otherwise have been. Taken together, these factors suggest that an expanding US budget deficit should remain a supportive force for corporate profits through the remainder of 2026.
If AI optimism persists and the US budget deficit continues to widen, US corporate earnings should keep rising. Both conditions look plausible in the near term. As long as inflation does not derail this scenario by pushing yields too high and compressing multiples, the current earnings-driven rally in US equities should remain sustainable.
3. The Markets: Pulled in Two Directions at Once
The issue, of course, is that inflation is lurking around the corner, driven not only by shifts in energy prices but also by fiscal and monetary policy, soaring asset prices, tight labor markets, trade tariffs and the AI capex boom.
As of May, US headline CPI inflation has surged to 4.2% year-over-year. In fact, the inflation rate, as measured by the Core Personal Consumption Expenditure, has now been above the Fed’s 2% target every month for more than five years, and there are few reasons to believe that this target will be hit any time soon. In turn, at the time of this writing, the 10-year nominal treasury yield is above 4.5%, approaching what many consider to be the “danger zone.”
At a fundamental level, there is an inherent inconsistency between record-high equity markets, tight credit spreads, and elevated bullish sentiment, while at the same time interest rates and energy prices are signaling a potentially lasting negative impact of inflation on the economy.
This is why it is not surprising that every development in the Iran conflict, and every shift in oil prices, causes so much volatility. The markets are being tugged in two directions at once.
This is happening at a time when the share of investors expecting stock prices to rise is now the second highest on record, even as markets continue to make new highs. Margin debt has escalated, suggesting that the stock market has become increasingly leveraged as greed overcomes fear. These euphoric conditions seem to ignore underlying risks.
Investors need to remember that markets climb slowly and can fall very quickly. As the saying goes, stocks take the stairs up and the elevator down. Thus, while the current momentum seems to have a solid foundation, caution remains warranted.
4. Lingering Risks: AI spending, Liquidity, and the Long-Term Impact of the Iran War
Inflation risks aside, markets are cyclical by nature and at some point, the momentum will inevitably shift for one reason or another. So what else is on our mind?
An important question for investors is the trajectory of AI capital spending. To paraphrase an old quip, $100 billion here, $100 billion there, and pretty soon, we are talking about real money. Can the current level of spending continue and drive equities higher?
The so-called hyperscalers – Amazon (AMZN), Alphabet (GOOGL), Microsoft (MSFT), and Meta (META) – have announced 2027 capex spending plans totaling $815 billion, up from $636 billion in 2026, with Goldman Sachs estimating that the actual number might get closer to $1.1 to $1.4 trillion. McKinsey estimates that the global demand for data center capacity could in fact triple by 2030, and that the rollout between now and then could cost a staggering $6.7 trillion.
This is an unprecedented level of capex, in particular for assets that have a fast depreciation cycle and can become obsolete within a few years (or a couple releases of new Nvidia chips). How long will it be before investors start to question the return on investment for these companies? And accept the dilution that will inevitably accompany additional equity issuance?
These are important questions given the concentration of the market and how much of investors’ portfolios these “AI companies” represent. For now, investors seem willing to absorb a growing supply of equity, based on their confidence in the potential of AI and a preference for growth over current profitability. But with every future IPO, lock-up expiry and secondary offering, that appetite will be tested a little further.
Liquidity is becoming an issue to think about. As Gavekal Research has observed, the temporary drawdown of global oil inventories caused by the Iran war has freed liquidity, but restocking these reserves will reverse this, draining capital from financial assets. Gavekal estimated that when the Strait of Hormuz was closed, and oil inventories started to be drawn down without being replenished, about $650 billion in capital previously tied up in funding energy inventories was progressively released. At some point, whether the Strait re-opens and inventories start to be rebuilt, or it remains closed and inventories empty out, this liquidity will be used to purchase oil. Perhaps not just oil, as governments may also seek to become more resilient and look to build reserves of all kinds of commodities such as natural gas, fertilizer, wheat and rice, following the example of China which holds a strategic frozen pork reserve.
The stockpiling of commodities by countries, and maybe even companies, will be a liquidity drain, just at a time when:
- The hyperscalers and other AI-related companies may now drain the market with share issuances of unprecedented size, instead of creating liquidity through buybacks.
- Following the Iran war, the Middle-Eastern countries may now use part of their sovereign wealth funds to repair their energy-producing infrastructure and re-organize their supply chains to bypass the Strait of Hormuz. The new pipelines, new refineries, and new ports created by these infrastructure investments will represent billions of dollars of spending that will not be available for other uses.
- In this tense geopolitical climate, developed countries may ramp up defense spending dramatically. In the United States, President Trump has proposed increasing military spending from about $1 trillion to $1.5 trillion a year. At the same time, European, Asian, and Middle-Eastern countries are all considering building up their military capabilities.
Over the coming years, the demand for funding will be enormous. Where is all this capital going to be sourced? And most importantly for stocks and bonds, at what price?
5. An Evolving Investment Environment?
The old world that investors became accustomed to over the past several decades was characterized by cheap labor, stable energy flows, relatively low interest rates, relatively free trade, and a US-anchored security system encouraging the recycling of global financial surpluses into US assets. This old world was fundamentally deflationary.
The Iran conflict has highlighted forces likely to shape the global economy for years to come. We are entering a new world, characterized by tariffs, increased trade within regional blocks, the reshoring of industries and supply chains for national security reasons, resource competition, larger precautionary oil and other commodity reserves by both countries and companies, and the potential recycling of excess savings into commodity rather than Treasuries. This new world may be less efficient and more inflation prone.
In turn, we believe that the Iran war has accelerated a broader shift that was already underway: a structural transition from a world in which most economic shocks were deflationary in nature, to a world in which most economic shocks will be inflationary in nature.
This has significant implications for investors and those managing portfolios. We will address how we plan to adapt our investment strategy in a separate upcoming paper.
6. What Does This Mean for Us?
At times of uncertainty, it is important to rely on a few fundamental investment principles:
- Patience is key. Time in the market is more important than market timing.
- Asset allocation will be the main driver of your returns. Trying to enhance returns by trading individual securities or sectors is very hard. As markets gyrate from one sector to another, remember that asset allocation will have the highest impact on the performance of your portfolio.
- Portfolio construction matters. Exposure to various asset classes and investment strategies should match your investor profile, liquidity needs, tolerance for volatility, tax situation, and time horizon.
- Diversification is your friend. Thoughtfully combining strategies that do not move in lockstep and introducing strategies that exhibit very low correlation to traditional asset classes, will reduce the volatility of your portfolio across a variety of environments.
If you would like to discuss how these factors may influence your investment portfolio, please reach out to your Fiduciary Trust investment officer or Sid Queler at queler@fiduciary-trust.com.
Exhibit E: Fiduciary Trust Asset Class Perspectives

Source: Fiduciary Trust Company. These forward-looking statements are as of July 1, 2026 and based on judgements and assumptions that change over time. Tactical allocation denotes positioning relative to a strategic benchmark. Allocation denotes the percentage weight in a portfolio assuming a 60% equity, 35% fixed income, 5% cash benchmark.


