
- The traditional small-cap premium has eroded. Public small-cap stocks have underperformed in recent decades, as the structural drivers of excess returns have weakened.
- The quality of public small-cap companies has declined. Many high-growth businesses now remain private longer, leaving public indices with a higher concentration of mature or lower-quality companies.
- Private equity has become the primary venue for small-company growth. The investable universe of private companies is significantly larger, offering broader access to earlier-stage and higher-growth opportunities.
- Private equity has delivered stronger returns relative to public small-cap benchmarks. Over time, private equity has been a more effective way to capture small-company value creation than public markets.
- Portfolio construction should evolve accordingly. Investors able to tolerate lower liquidity may benefit from supplementing or partially replacing public small-cap exposure with private equity.
For decades, investors relied on public small-cap equities as a structural source of excess returns relative to large-cap stocks. That logic rested on a persistent “small-cap premium,” supported by both academic research and long-run empirical evidence. In recent history, however, this relationship has broken down. Public small-cap equities have underperformed, and the mechanisms that once generated excess returns have weakened.
At the same time, private equity has emerged as a major venue in which small companies grow and create value. Flows into private capital as well as regulatory shifts have driven many high-quality growth companies to remain private well beyond the point at which they would historically have accessed public markets. As a result, the traditional public small-cap universe increasingly represents a residual pool of lower-quality firms, while many of the most attractive opportunities have migrated to private markets.
We believe private equity represents an attractive alternative to public small-cap for investors able to tolerate the lower liquidity and transparency of these investments. Suitable investors should consider private equity not as a separate asset class but as a different way to gain exposure to business growth.
Why Have Small-Cap Stocks Underperformed in Recent Years?
For much of the twentieth century, small publicly traded companies reliably outperformed large-cap peers, forming what became known as the small-cap premium. This effect was documented academically beginning with Rolf Banz’s 1981 paper and later formalized in multifactor asset pricing models by Fama and French in 1992. For nearly five decades, investors could reasonably expect incremental returns for bearing the additional risks associated with smaller firms.
However, this premium began to erode shortly after it became widely identified and institutionalized. As with many market anomalies, broader awareness and increased capital allocation reduced its efficacy.
Exhibit A: Rolling 40-Year Total Returns of Small-Cap vs. Large-Cap U.S. Equities
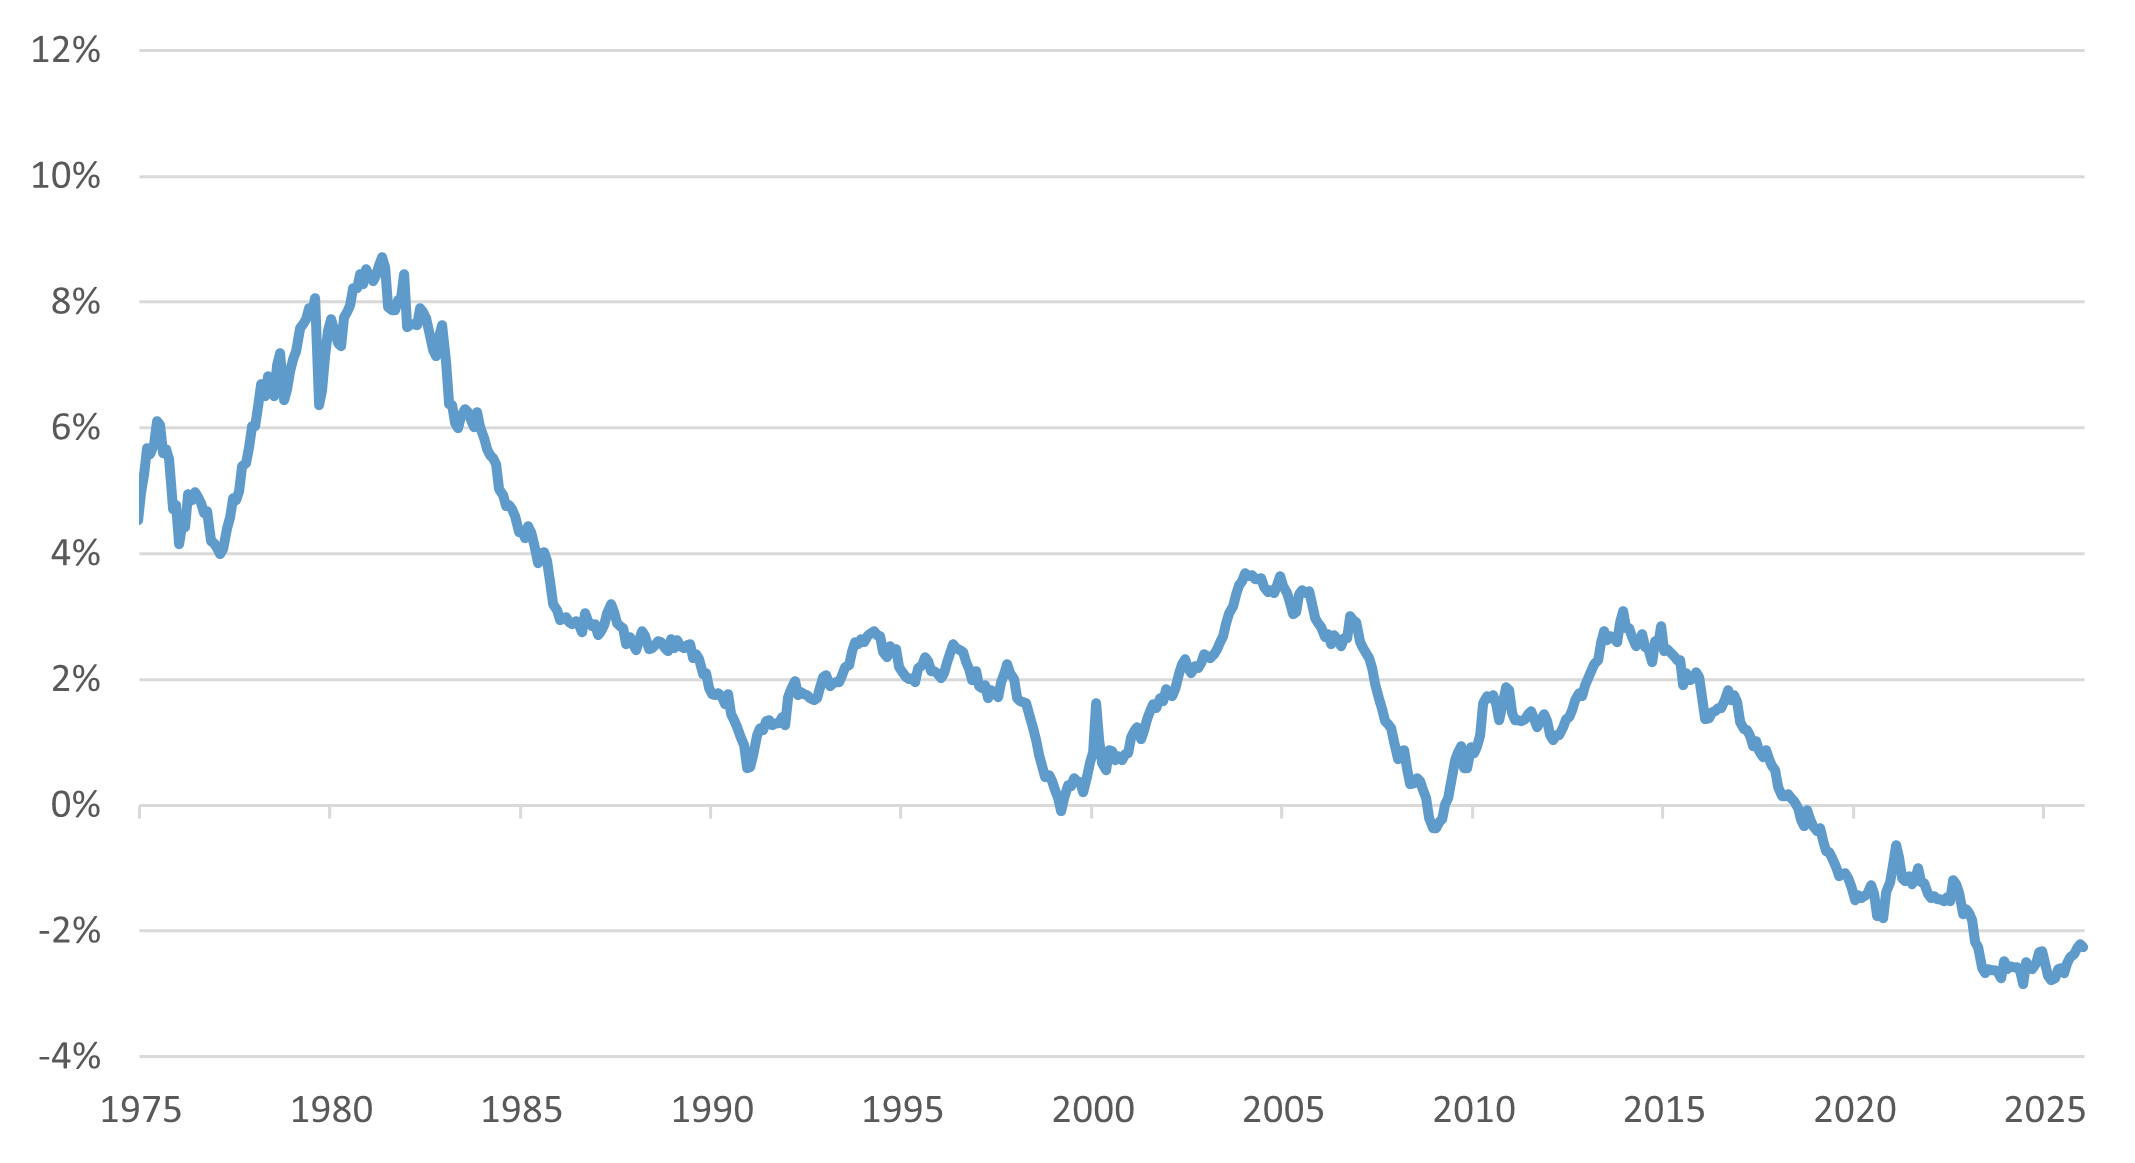
Source: Alpine Macro, Kenneth R. French Data Library, Fiduciary Trust Company. Data as of January 1, 2026. Small-cap and large-cap are determined by the bottom and top deciles of size.
As seen in Exhibit A, the long-run small-cap premium has steadily declined since the early 1980s – incidentally, right after Banz documented the phenomenon. This result is robust to multiple controls. Even after adjusting for the outsized influence of mega‑cap stocks (Exhibit B) or isolating value factor exposure (Exhibit C), the underperformance of public small caps persists.
Exhibit B: Rolling 40-Year Total Returns of Small-Cap vs. Large-Cap, Controlling for Mega-Cap Influence

Source: Alpine Macro, Kenneth R. French Data Library, Fiduciary Trust Company. Small-cap and large-cap are determined by the bottom and top quartiles of size. Companies are equal-weighted rather than market-cap weighted, reducing the influence of mega-caps.
Exhibit C: Rolling 40-Year Total Returns of Small-Cap vs. Large-Cap, Controlling for Value Characteristics

Source: Alpine Macro, Kenneth R. French Data Library, Fiduciary Trust Company. Data as of January 1, 2026. Returns are averaged across groups of stocks, grouped by their book-to-market ratio (the “Value factor”) in order to remove the Value effect.
Has the Quality of Public Small-Cap Companies Declined?
Structural changes also influenced the composition of the public small-cap universe. Beginning in the 1980s, leveraged buyouts and institutional private capital offered growing companies a viable alternative to public capital. Regulatory shifts then reduced the incentive to be a public company: The Sarbanes‑Oxley Act of 2002 meaningfully increased the fixed costs of being a public company, and the JOBS Act of 2012 allowed companies to stay private for longer by raising the threshold of shareholders a company could have before requiring SEC registration.
Consequently, the IPO was no longer the “default” option for companies looking for growth capital. Exhibit D shows that listed companies have declined in the last 25 years while private equity has played an increasingly fundamental role in financing smaller companies.
Exhibit D: Number of Domestically Listed Companies vs. PE-Backed Companies

Source: Constitution Capital Partners, Fiduciary Trust Company. Data as of Q2 2025.
Among the companies that do decide to go public, they enter the public markets later in their lives. The median age of companies at IPO has increased from 8 years (from 1980-2000) to 11 years (from 2001-2025).1 Companies entering the public markets are, on average, in a more mature phase than before and the structural growth advantage of small-cap investing is thus diminished.
Empirical evidence supports the notion that the public small-cap universe is missing many of the economy’s key growth companies. Fama and French in 2006 found that the small-cap premium, which they had documented in 1992, owed almost all of its outperformance to companies “graduating” to the large/mid-cap index, with typically 8-12% of the index market value graduating.2 That mechanism has largely broken down in recent years. Recent graduation rates have been closer to 2%, and in the last 3 years, more companies have been “demoted” into the small-cap index rather than “promoted.”3, 4 Thus, the small-cap index contains an increasing number of companies that are struggling to defend their business rather than financing the next stage of growth.
Concurrently, the proportion of unprofitable companies within public small‑cap indices has risen to historically elevated levels, as seen in Exhibit E. The result is an investable universe increasingly dominated by structurally weaker firms.
Exhibit E: Percentage of Russell 2000 Companies with Negative Earnings

Source: Bloomberg, Fiduciary Trust Company. Data as of December 31, 2025. Earnings are measured by 12-month trailing EPS.
Has Active Management Added Value in Small-Cap Investing?
One might expect active management to mitigate these problems by avoiding low-quality companies. In practice, public market active management as a whole has not fared much better than passive. Exhibit F presents the distribution of rolling five-year excess returns for active small-cap managers relative to the Russell 2000, showing limited and inconsistent value added over time. While certain managers have been successful, the structural headwinds to small-cap equities appear to have impacted most managers.
Exhibit F: Rolling 5-Year Excess Returns of Small-Cap Blend Managers

Source: Morningstar, Fiduciary Trust Company. Data as of May 31, 2026. Excess returns are relative to the Russell 2000 for all managers and are annualized.
How the Small-Company Opportunity Has Shifted to Private Markets
While public small-cap equities have weakened, private markets have expanded dramatically, as shown earlier in Exhibit D. From an investor’s perspective, the bulk of “small company” opportunity lies in the private markets. Among companies with $100 million to $1 billion in revenue, there are about ten times more private companies than public (Exhibit G).
Exhibit G: Share Public vs. Private Companies

Source: JP Morgan, Guide to the Markets 1Q 2026, Fiduciary Trust Company.
Private equity therefore provides access to a much broader and more representative universe of small companies. These firms are often earlier in their growth trajectories, allowing investors to participate in value creation that is not represented in public markets.
Is Private Equity a More Effective Way to Capture Small-Company Returns?
Accordingly, private equity funds have enjoyed strong performance. Exhibit H compares private equity buyout fund performance to public benchmarks using the Public Market Equivalent (PME) method.5 Since 2008, median private equity performance has materially and consistently outperformed the Russell 2000. While mega-caps have captured much of the gains in the large-cap universe, private equity funds have captured much of the gains in the small-company universe.
Exhibit H: Performance of Small vs. Large Buyouts Relative to Public Market Indexes

Source: RCP Advisors, Pitchbook, Fiduciary Trust Company. Returns represent Horizon Pooled IRRs as of December 31, 2024. The RCP Small Buyout Index is a horizon calculation based on data compiled from 253 U.S. and Canadian buyout funds <$1B from RCP’s primary and small and emerging manager portfolios, including fully liquidated partnerships, formed between 1999 and 2024. Calculated net of underlying fund fees and expenses.
A PME greater than 1.0 indicates greater wealth creation than the public benchmark for equivalent capital deployment and timing. Consistent PMEs above 1.0 versus public small‑cap indices suggest that private equity has been a more effective vehicle for capturing small‑company returns over the past decade and a half. Furthermore, out of all private equity strategies, middle market buyout has had the highest median return over the last 20 years.6 Middle market buyout operates with the same size companies as public small-cap. These managers appear to have benefitted from the value creation pulled from public markets.
How Portfolios Should Evolve in Today’s Small-Cap Landscape
The traditional case for public small‑cap exposure is no longer sufficient on its own. Although public small‑cap equities continue to play a role in diversified portfolios, investors should take note that the investable universe has contracted relative to private markets, average quality has declined, and the structural mechanisms that historically drove excess returns have weakened. As a result, relying exclusively on public small‑cap exposure is increasingly unlikely to capture the full scope of small‑company growth that investors seek. Active management can mitigate these challenges, but it has not consistently restored the historical small‑cap premium.
At the same time, private equity has become a central venue for small‑company formation, growth, and value creation. Its broader opportunity set, ability to add value, and earlier access to company life cycles indicate that a meaningful share of the economic small‑company opportunity now resides outside public markets. Private equity managers can also exploit market inefficiencies that may be more elusive in public markets. Suitable investors should consider either supplementing or replacing small-cap exposure with private equity.
If you would like to discuss strategies to optimize your investment portfolio, please reach out to your Fiduciary Trust officer or Sid Queler at queler@fiduciary-trust.com.


