July 2, 2024
With the year half over, U.S. equities have once again distinguished themselves by lapping their international developed market peers, with the former gaining 15.3% and the latter 6.0%1. During the second quarter, the S&P 500 Index gained 4.3%, while the technology-heavy Nasdaq jumped 8.5%. Global equities gained 1.3%, assisted by a strong showing from emerging markets, which advanced 5.3%.2
From a business cycle perspective, the U.S. remains in fine fettle. Employment, industrial production, and purchasing managers’ indexes in both the service and manufacturing sides of the economy suggest growth remains the order of the day. Remarkably, the housing market seems to be dealing well with higher interest rates, as a shortage of inventory helps sustain rising prices. On the inflation front, the rise in consumer prices continues to remain stubbornly above the central bank’s target, complicating any interest rate relief investors anticipate. Indeed, an oft-quoted measure of the economy’s growth, the Federal Reserve Bank of Atlanta’s GDPNow nowcasting model pegs second quarter growth at 2.3%.3
All May Not Be as It Seems
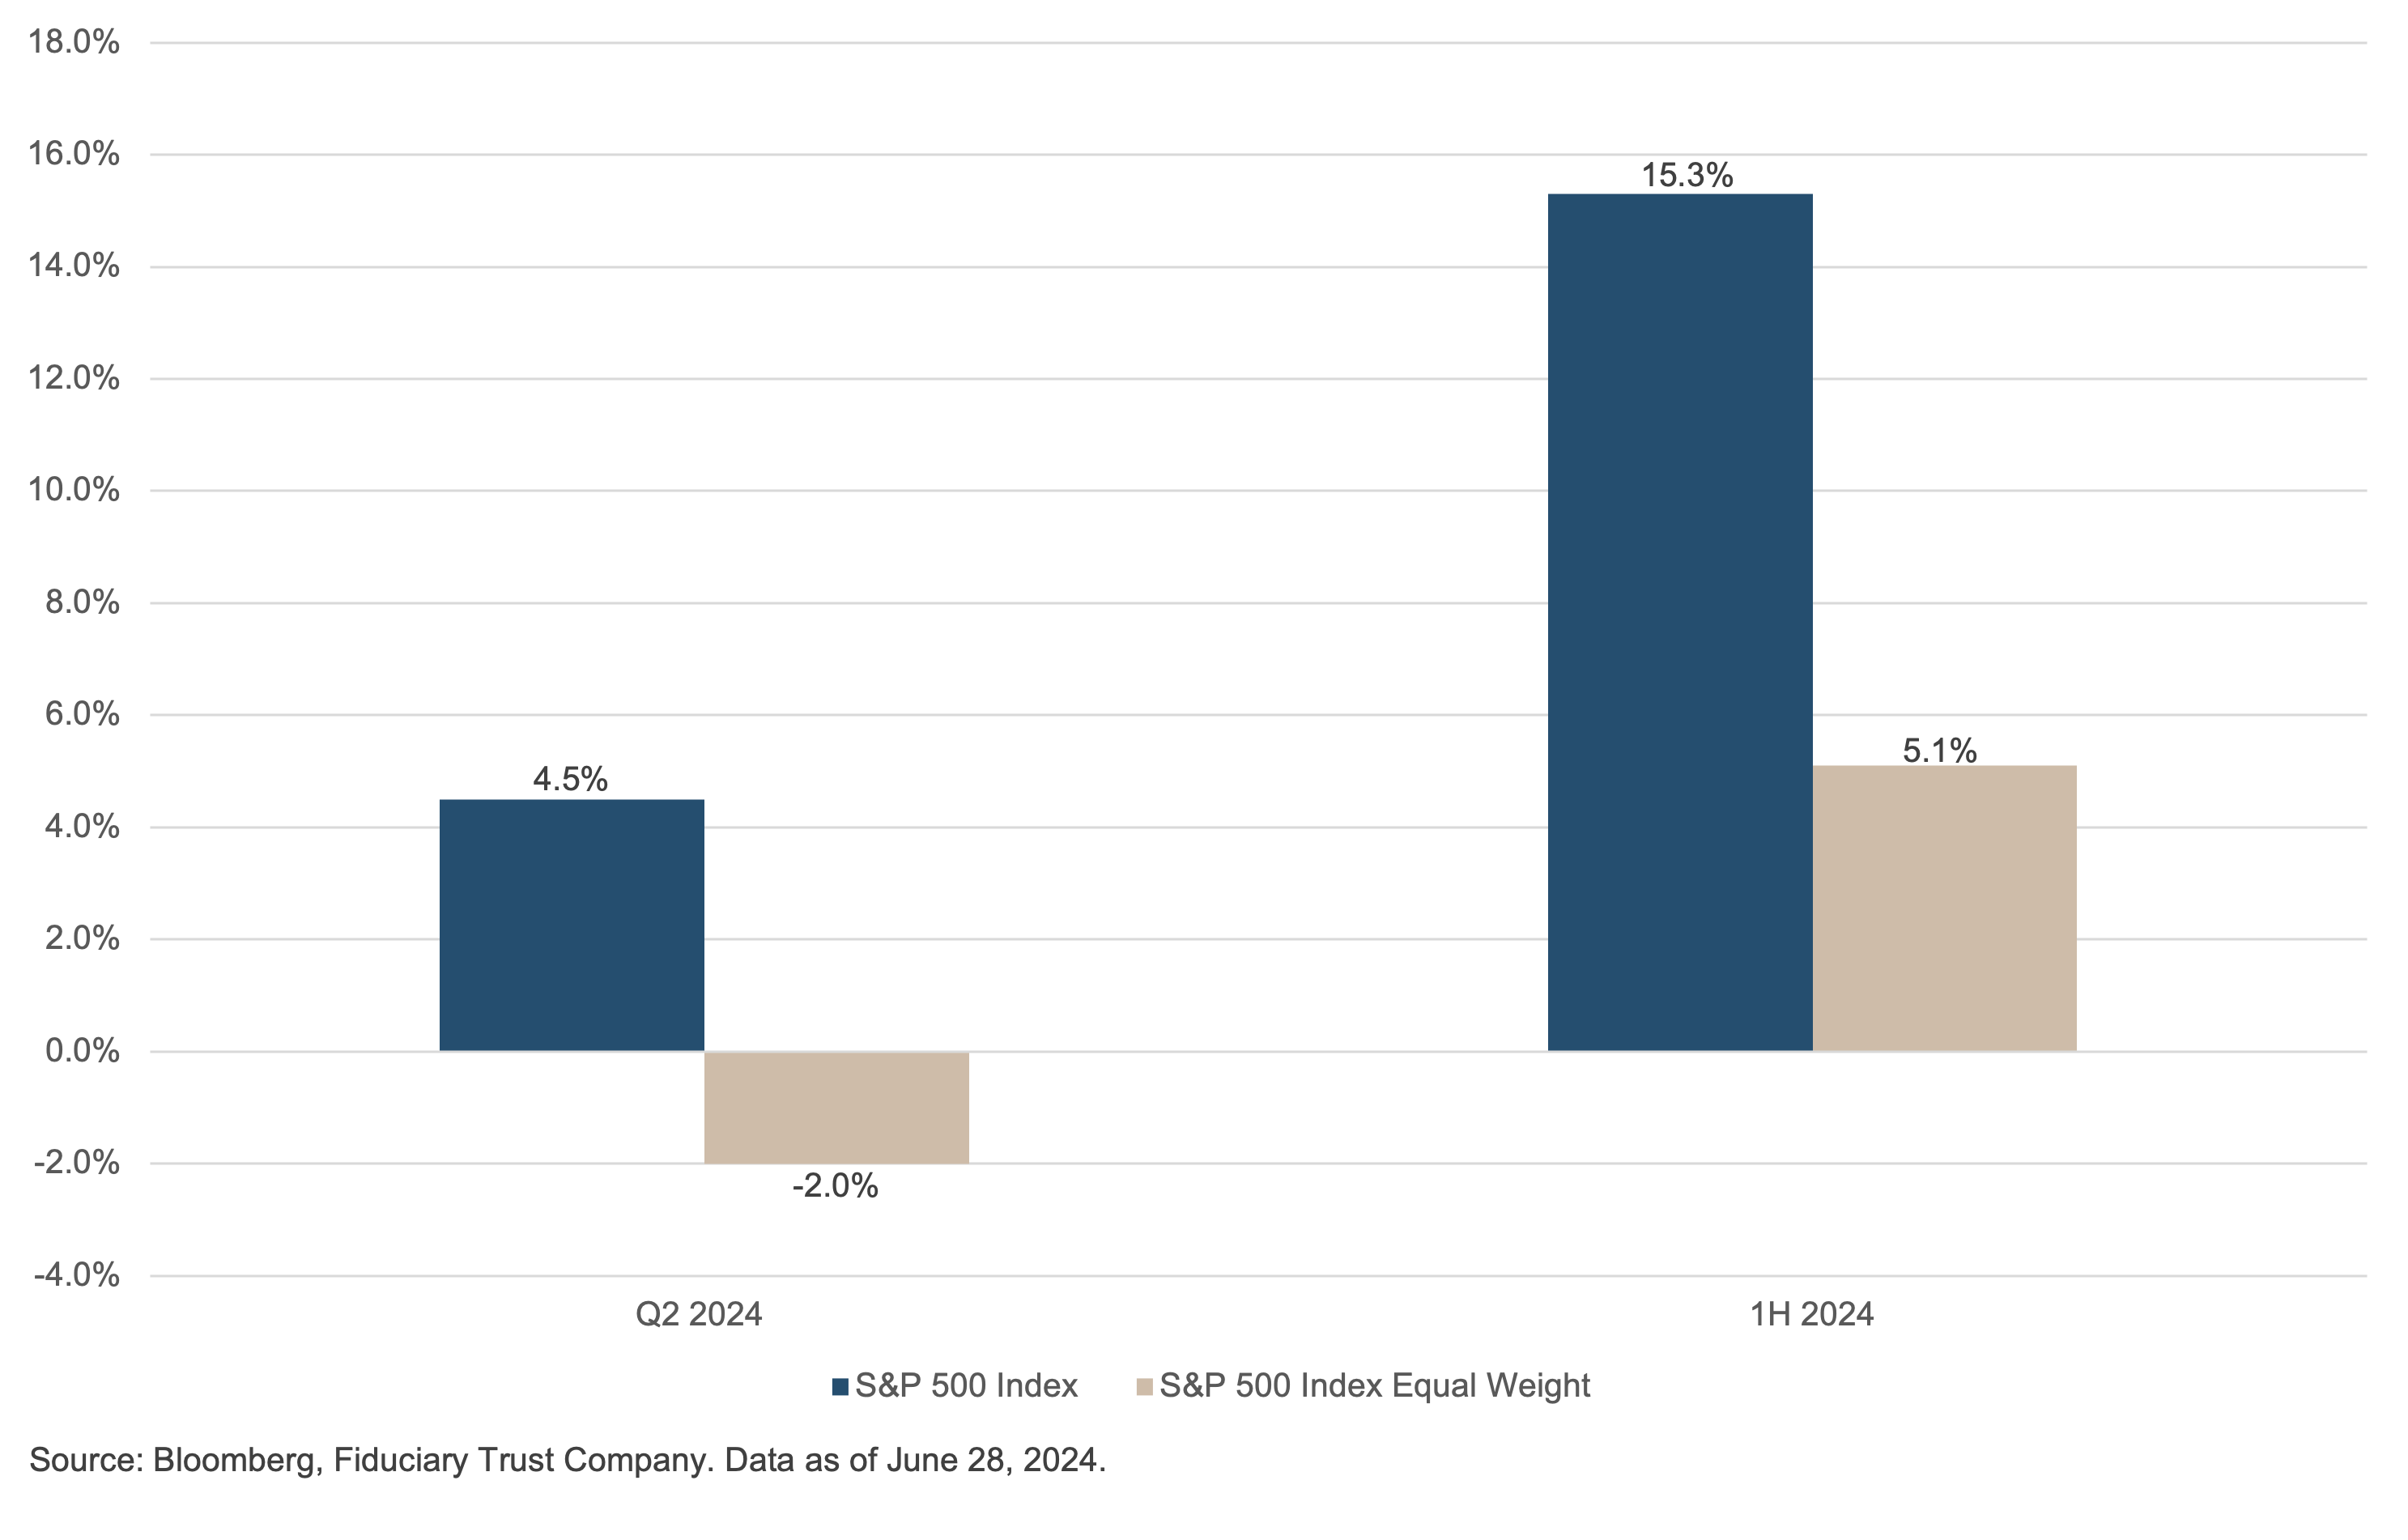
While returns of the S&P 500 Index are impressive this year, it is impossible to ignore how top heavy the index is and the dominance of two industry sectors. From a return perspective, these distortions are clear when comparing returns on a market-capitalization basis versus equal-weight. The difference between the two is important: The size of a company is what dictates its weight in the market capitalization version, whereas the equal-weight index represents a proxy for the returns of the average stock.
On a year-to-date basis, the oft-quoted market-capitalization version of the index is up more than three times that of the equal-weight version. For the quarter, the results are even starker, as the average stock has declined while the market-cap version registered an impressive return.
Exhibit A: S&P 500 Index Market Cap vs. Equal Weight Total Return
The record run of the S&P 500 is impressive this year as it has logged more than 30 record-high closes.
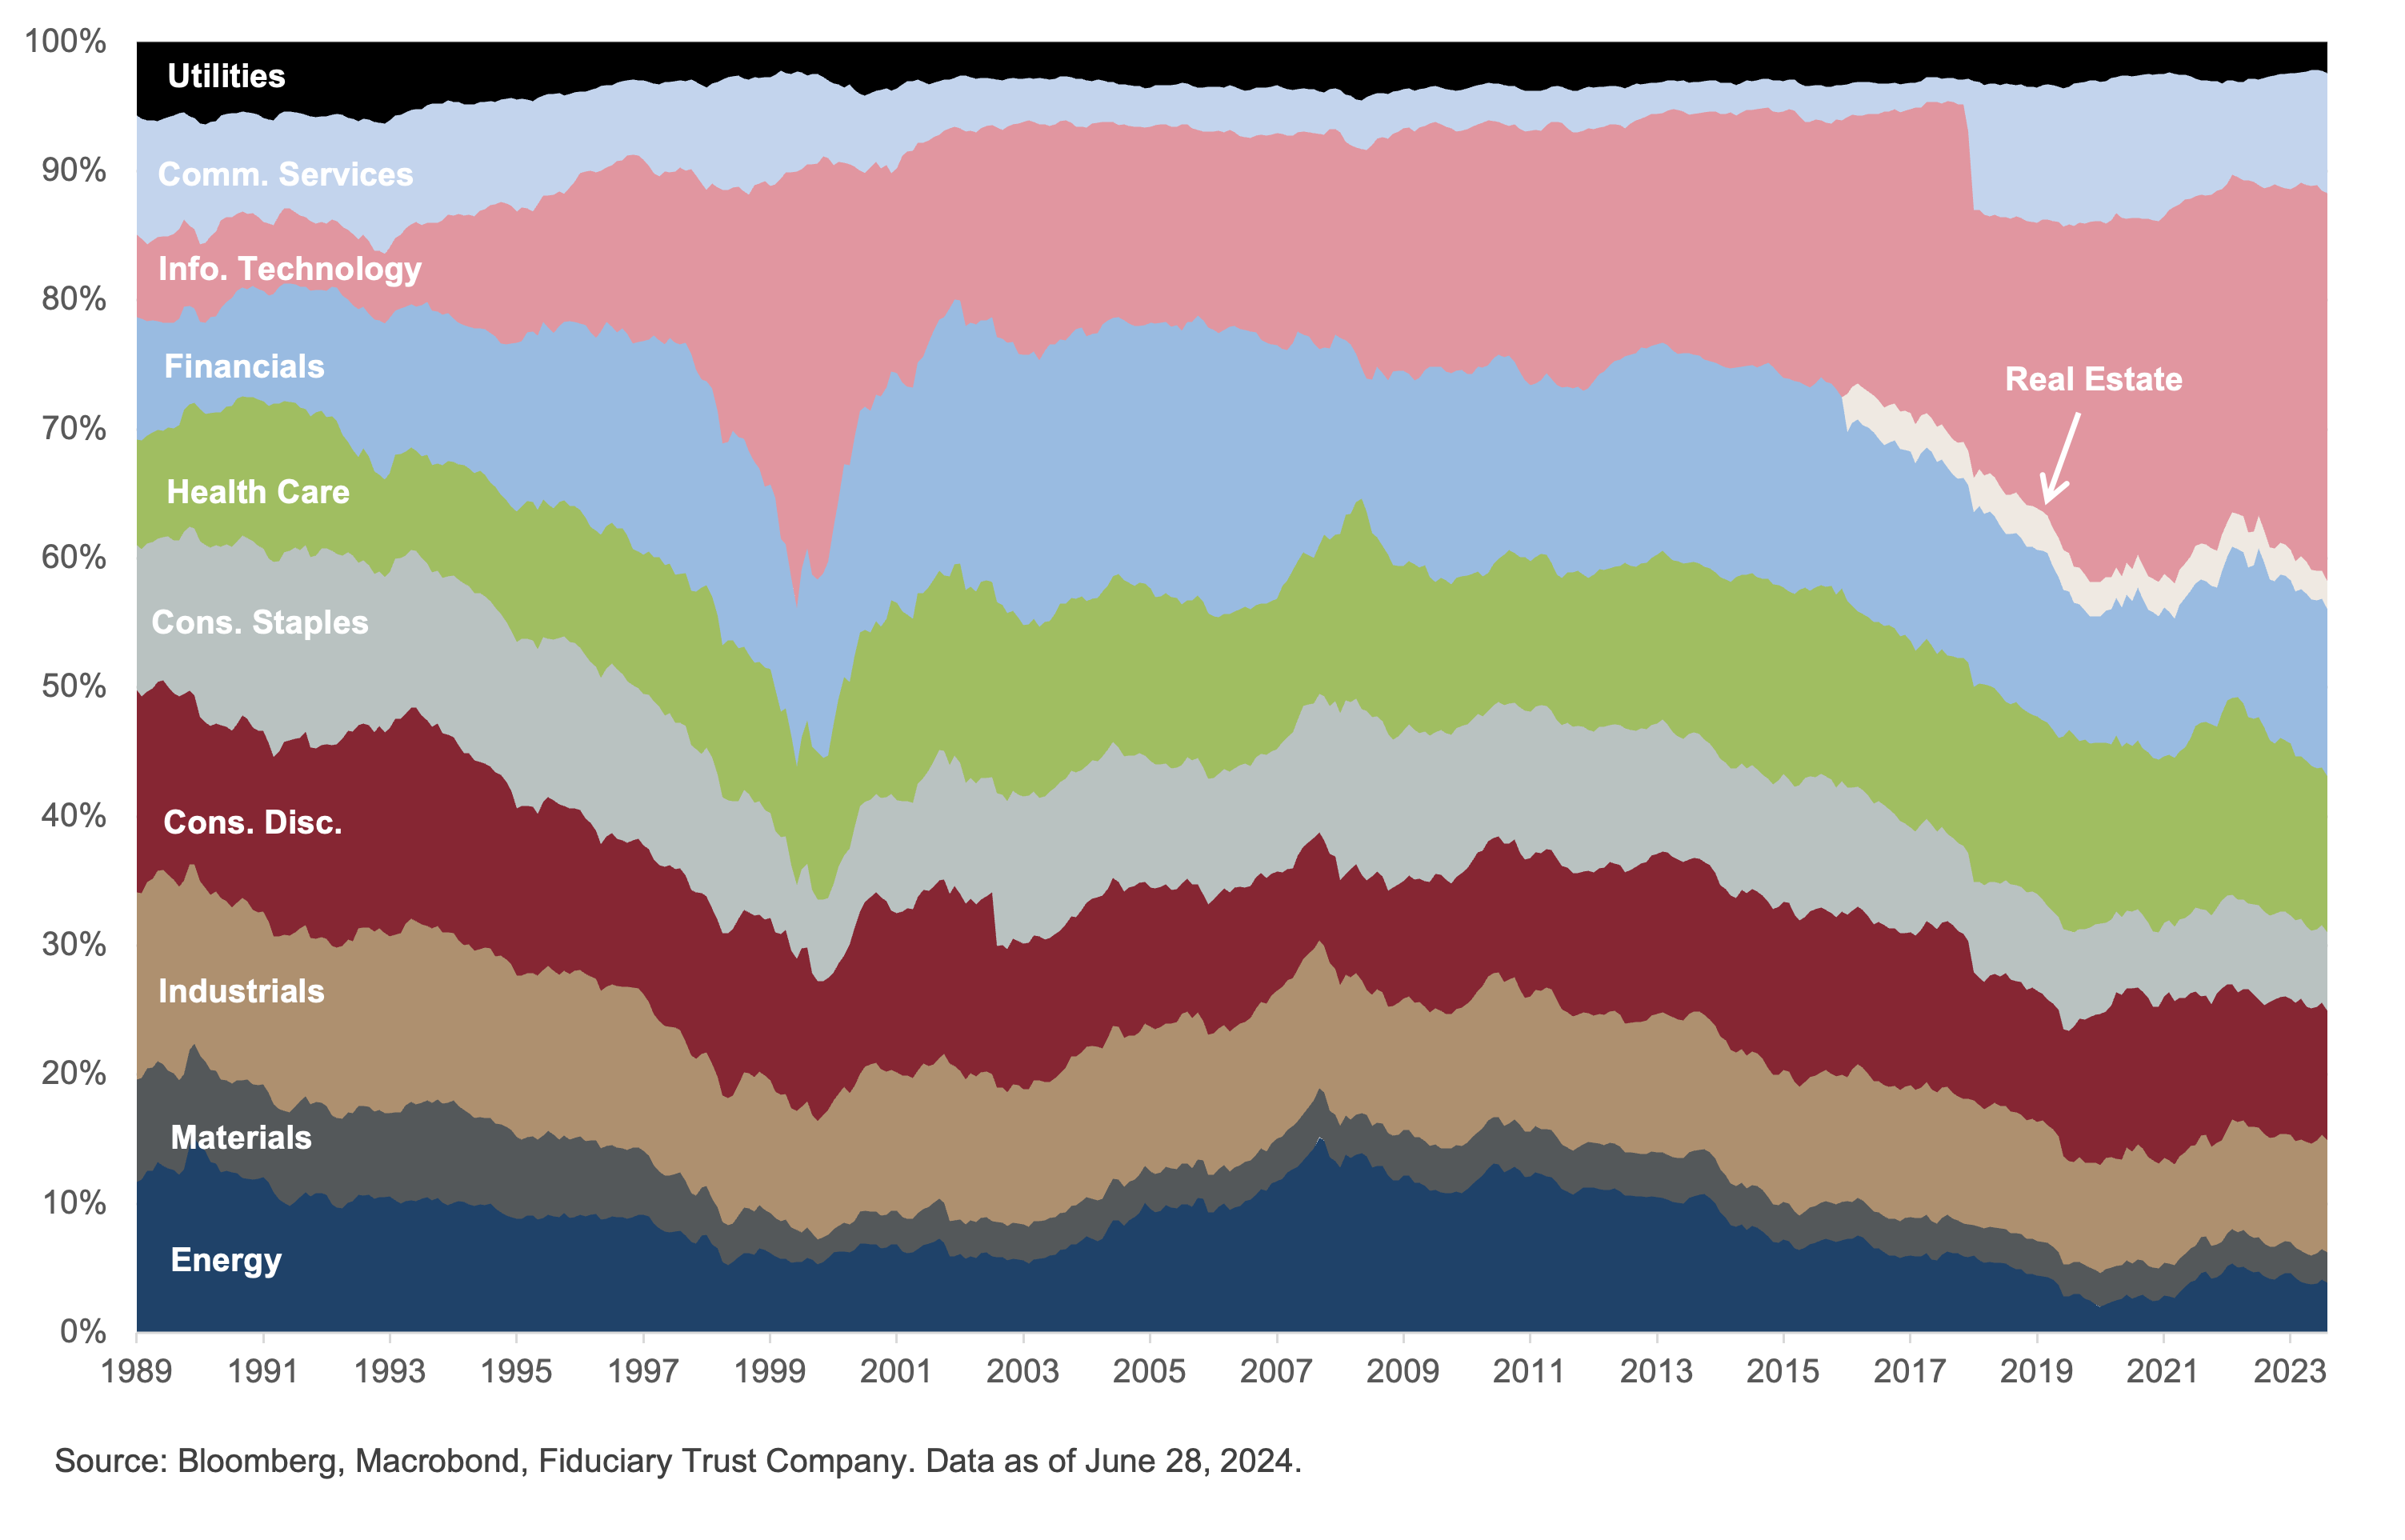
The market’s concentration sits primarily in the technology and communication services sectors, which together now account for 41% of the index, a level last reached when the index peaked during the Y2K technology boom.4 The importance of the leadership of these two sectors is seen when looking at the performance and composition of the top 10 names in the index. Year to date, the top 10 names are up 28.5%, while the overall index is up 15.3%.5 Technology and Communication Services account for roughly 76% of this top tier of the benchmark.6
Exhibit B: S&P 500 Sector Weights
All Things AI
The drivers of performance this year are a continuation of those of 2023. Artificial Intelligence (AI) has seized the attention and capital of investors. Undoubtedly, the symbol of all things AI is chipmaker NVIDIA. This company, which was previously known as a chipmaker for online gaming devices, has found new and growing markets as companies realized that their chips are perfectly suited for generative AI’s large language models, autonomous vehicles, crypto mining, and data center platforms.7 NVIDIA’s share price has rocketed more than seven-fold since the start of 2023. Its corresponding weight in the S&P 500 Index has leapt from 1.11% to 6.34%.8 Put another way, the company has added $2.6 trillion in value since the start of 2023, which is $200 billion more than the combined market value of Exxon, J.P. Morgan, Procter & Gamble, and Home Depot.9
The AI boom has also pulled the share prices of adjacent companies such as Microsoft, Amazon, and Google higher. The parabolic performance of companies in this space raises questions about whether it is sustainable. How, then, is one to comprehend that which appears incomprehensible? If the boom in AI stocks represents a surge in the capital spending cycle related to this sector, then examining the nature and features of the capital spending cycle might shed light on the current state of play. It also might hint at what is to come.
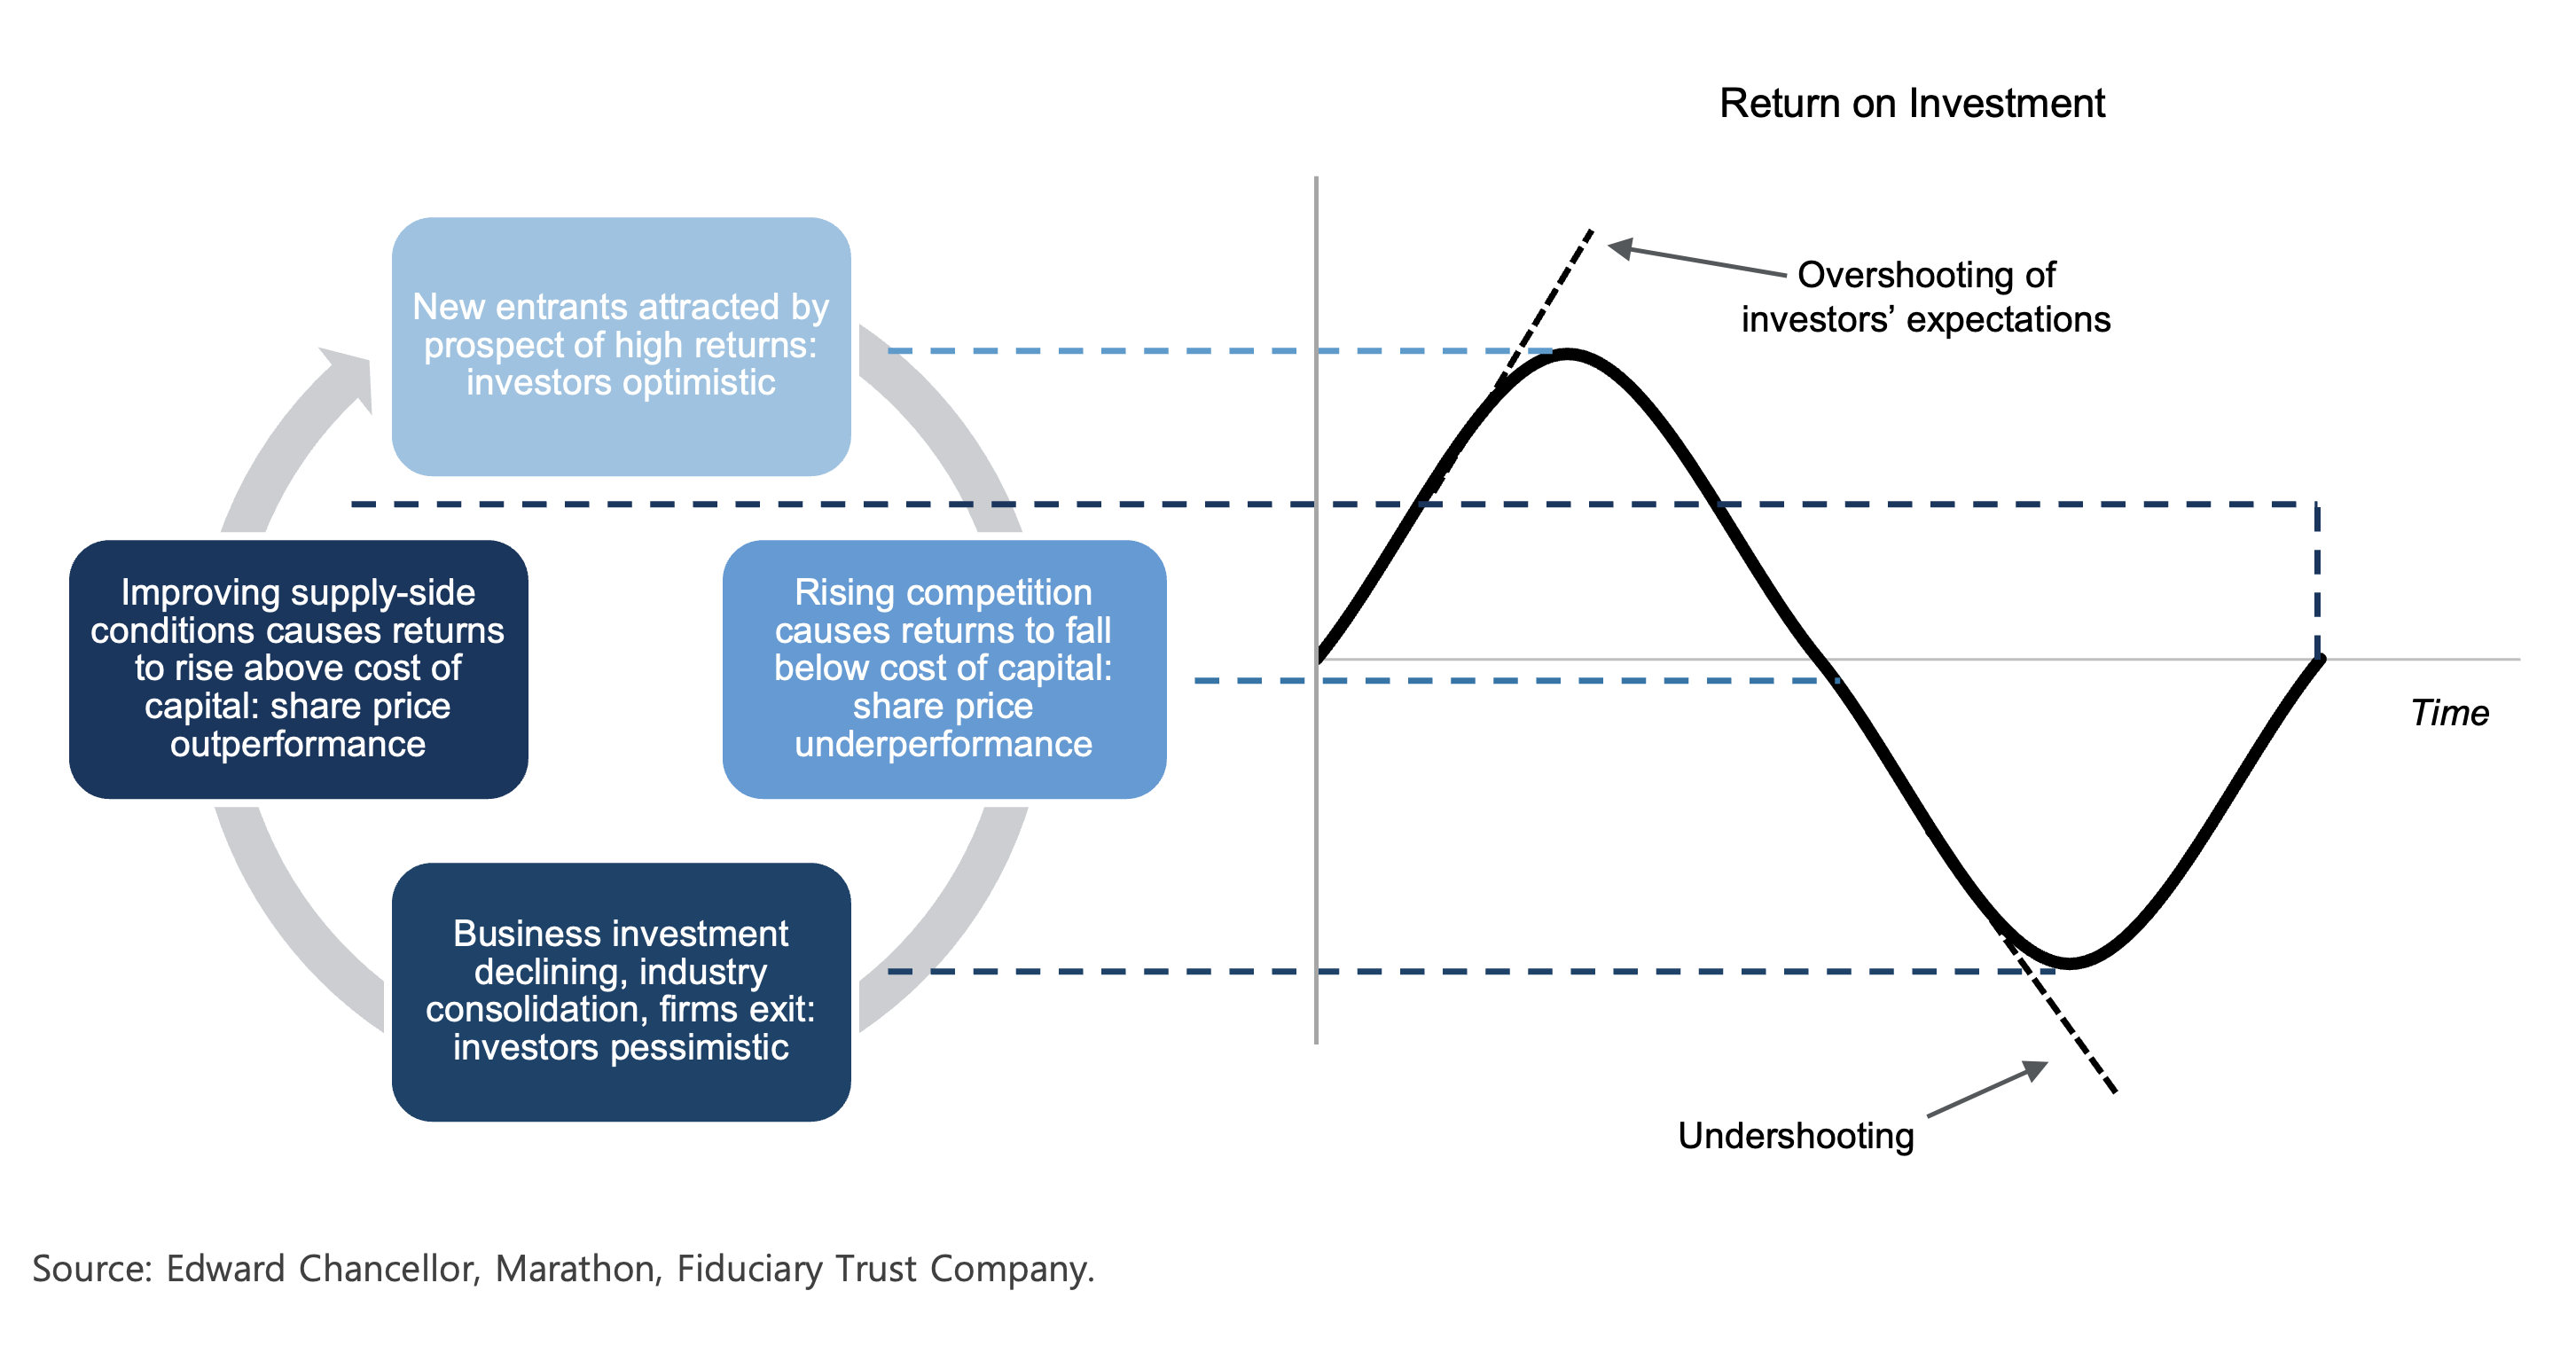
Capital spending cycles across industries exhibit remarkably similar features. Whether it be shipping, mining, energy extraction, paper production, or computer chips, the cycle generally consists of four phases that turn from virtuous to vicious.10
Exhibit C: The Business Investment Cycle
The Phases:
- Phase 1: Favorable supply conditions push returns well above the cost of capital, creating shareholder wealth, which drives strong stock performance.
- Phase 2: High returns attract new competition seeking to claim market share. This attracts investors seeking to profit from market conditions.
- Phase 3: Rising competition and investment generate an unfavorable supply-demand dynamic that causes returns on investment to eventually fall below the cost of capital. This results in disappointment from the newly arrived investors and share prices fall.
- Phase 4: With returns on investment no longer being economic, firms stop investing and, in some cases, divest. Some companies leave the industry and others are consolidated into large entities. Disappointed and sitting with losses, investors abandon the industry.
From this vantage point, it appears that it’s still early days for the AI capital investment cycle. The demand to get access to chips for generative AI applications remains robust and profit growth, judging from NVIDIA’s results, remains eye-watering. It appears the cycle sits somewhere between late Phase One and early Phase Two.
Ultimately, what will determine the longevity of the cycle is whether visible signs of returns on investment result from the money spent on AI chips and accompanying accoutrements. So far, there is little in the way of profits being generated from the transformational stories heard from myriad applications of generative AI.
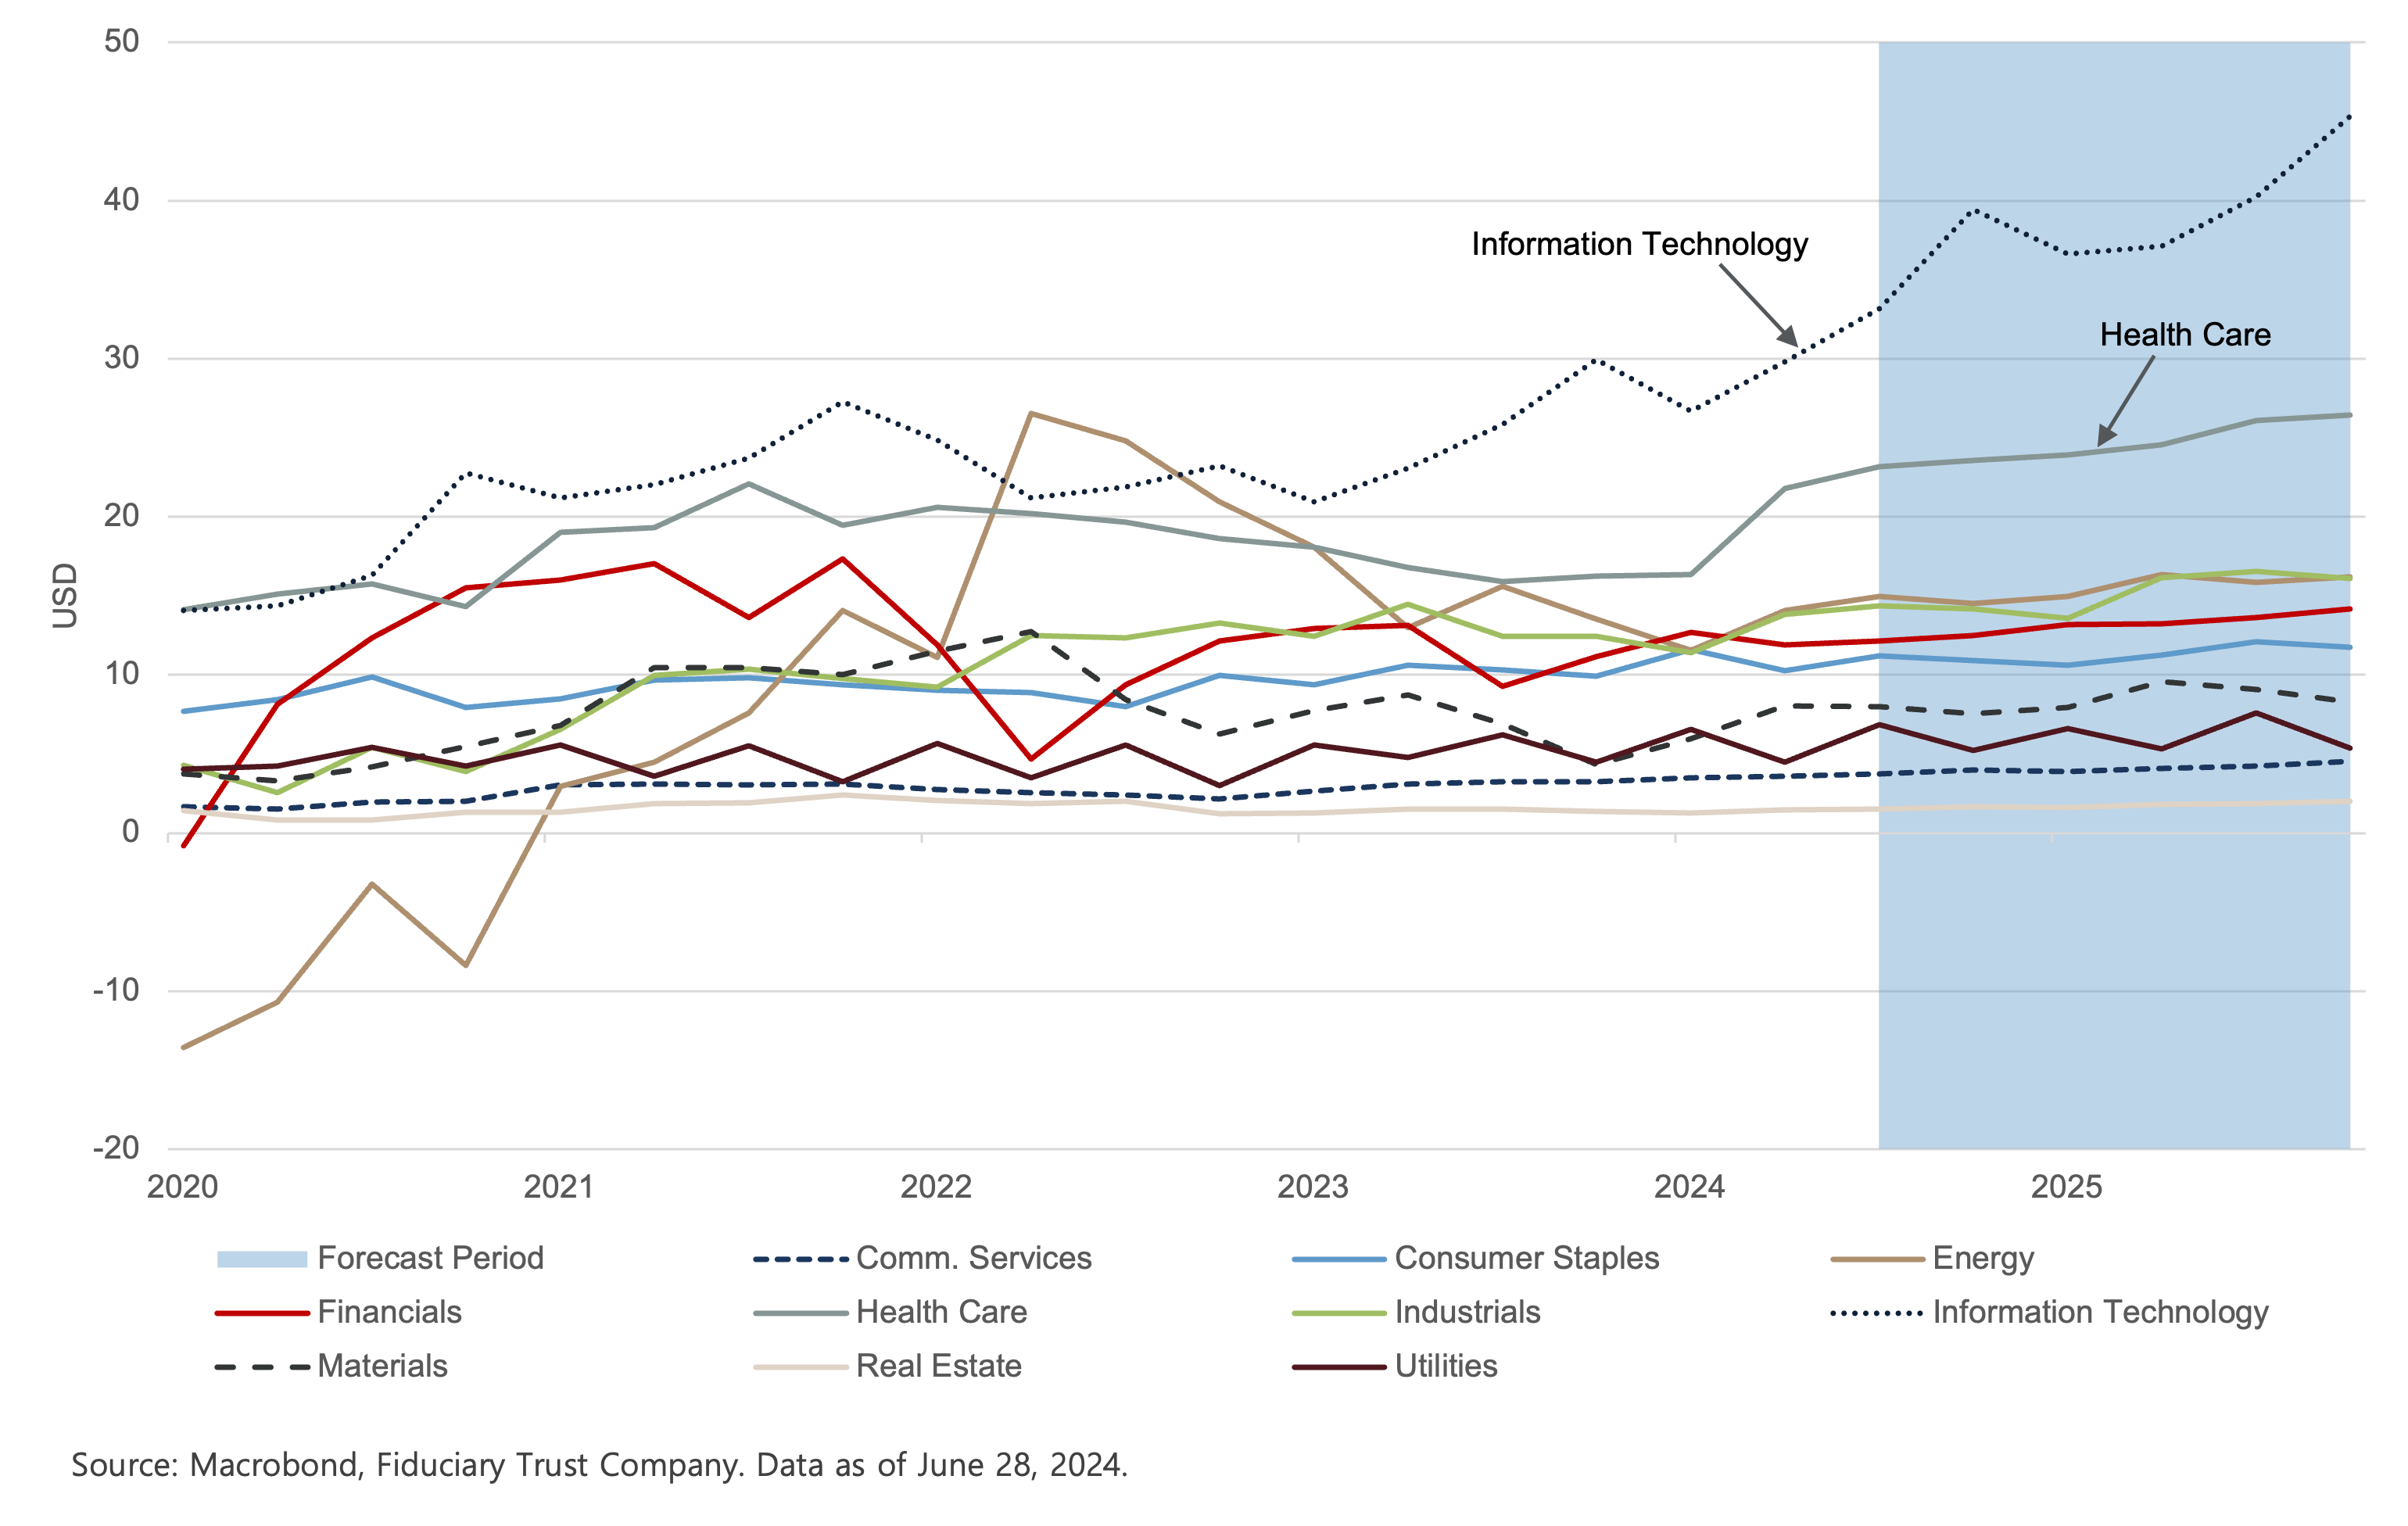
A quick check of earnings for the 11 sectors of the S&P 1500 Index reveals that only the Technology and Health Care segments have expected profit curves that show a noticeable upward bend. Profits in the tech sector, ground zero for AI capital spending, makes sense. In health care, rising profits is no doubt a bullish call on an aging population. The remaining nine sectors show little hint of the systemic transformation AI promises to deliver. Eventually, investors will have a “Jerry Maguire Moment,” where they demand to be shown the money (Phase Three). If the returns on considerable investment fail to materialize, then it’s on to Phase Four.
Exhibit D: S&P Composite 1500 Index: Operating EPS
Beyond NVIDIA and AI
Aside from developments in the stock market, a frequent question we are asked relates to the presidential election and its portent for the markets. In our 2024 Outlook, we asserted that recessions during a year in which there is an election for president are exceedingly rare. As noted above, the economy remains in good form. However, next year will require difficult decisions to be taken. Recently, the Congressional Budget Office revised its forecast for the budget deficit this year, increasing the gap between taxes and spending to $1.9 trillion, up from $1.4 trillion. The 36% jump is ascribed to higher interest costs, foreign aid, and other spending. The 64-page report is sobering. Large deficits for years to come will drive debt held by the public to 122% of GDP, an all-time high.11 This rising tide of debt could be exacerbated if the 2017 tax cuts are extended. These cuts, if continued, would need to be funded somehow. If past is prologue, it means more debt.
To the alarm of many, neither candidate shows any willingness to address the fiscal sustainability of government and the need to come to terms with the ballooning Federal debt. It appears that achieving a modicum of sustainable spending is the new third rail of politics. Afterall, fiscal probity is not a vote-getter, which means any talk of it is to be assiduously avoided. Markets will take a different view; already there are grumblings amongst keen-eye investors about how spending will be forced to correct.
Looking Forward
For the most part, the election will have little to offer investors other than spectacle. On the numbers, the economy is set to continue expanding and with it, earnings. Valuations will mean little with a zeitgeist that is all about growth. Sure, the refrain goes, “valuations are high, but profits are growing.” Inflation will most likely remain anchored around three percent, which makes it difficult for the central bank to lower interest rates in step with market expectations. A market buckle that brings with it a 10% drawdown in stock prices is a real possibility in the run-up to the election or shortly thereafter. Consequently, we continue to hold cash reserves and short-duration fixed income to take advantage of any durable pullbacks that develop.
As always, please contact your Fiduciary Trust Officer if you have any questions.
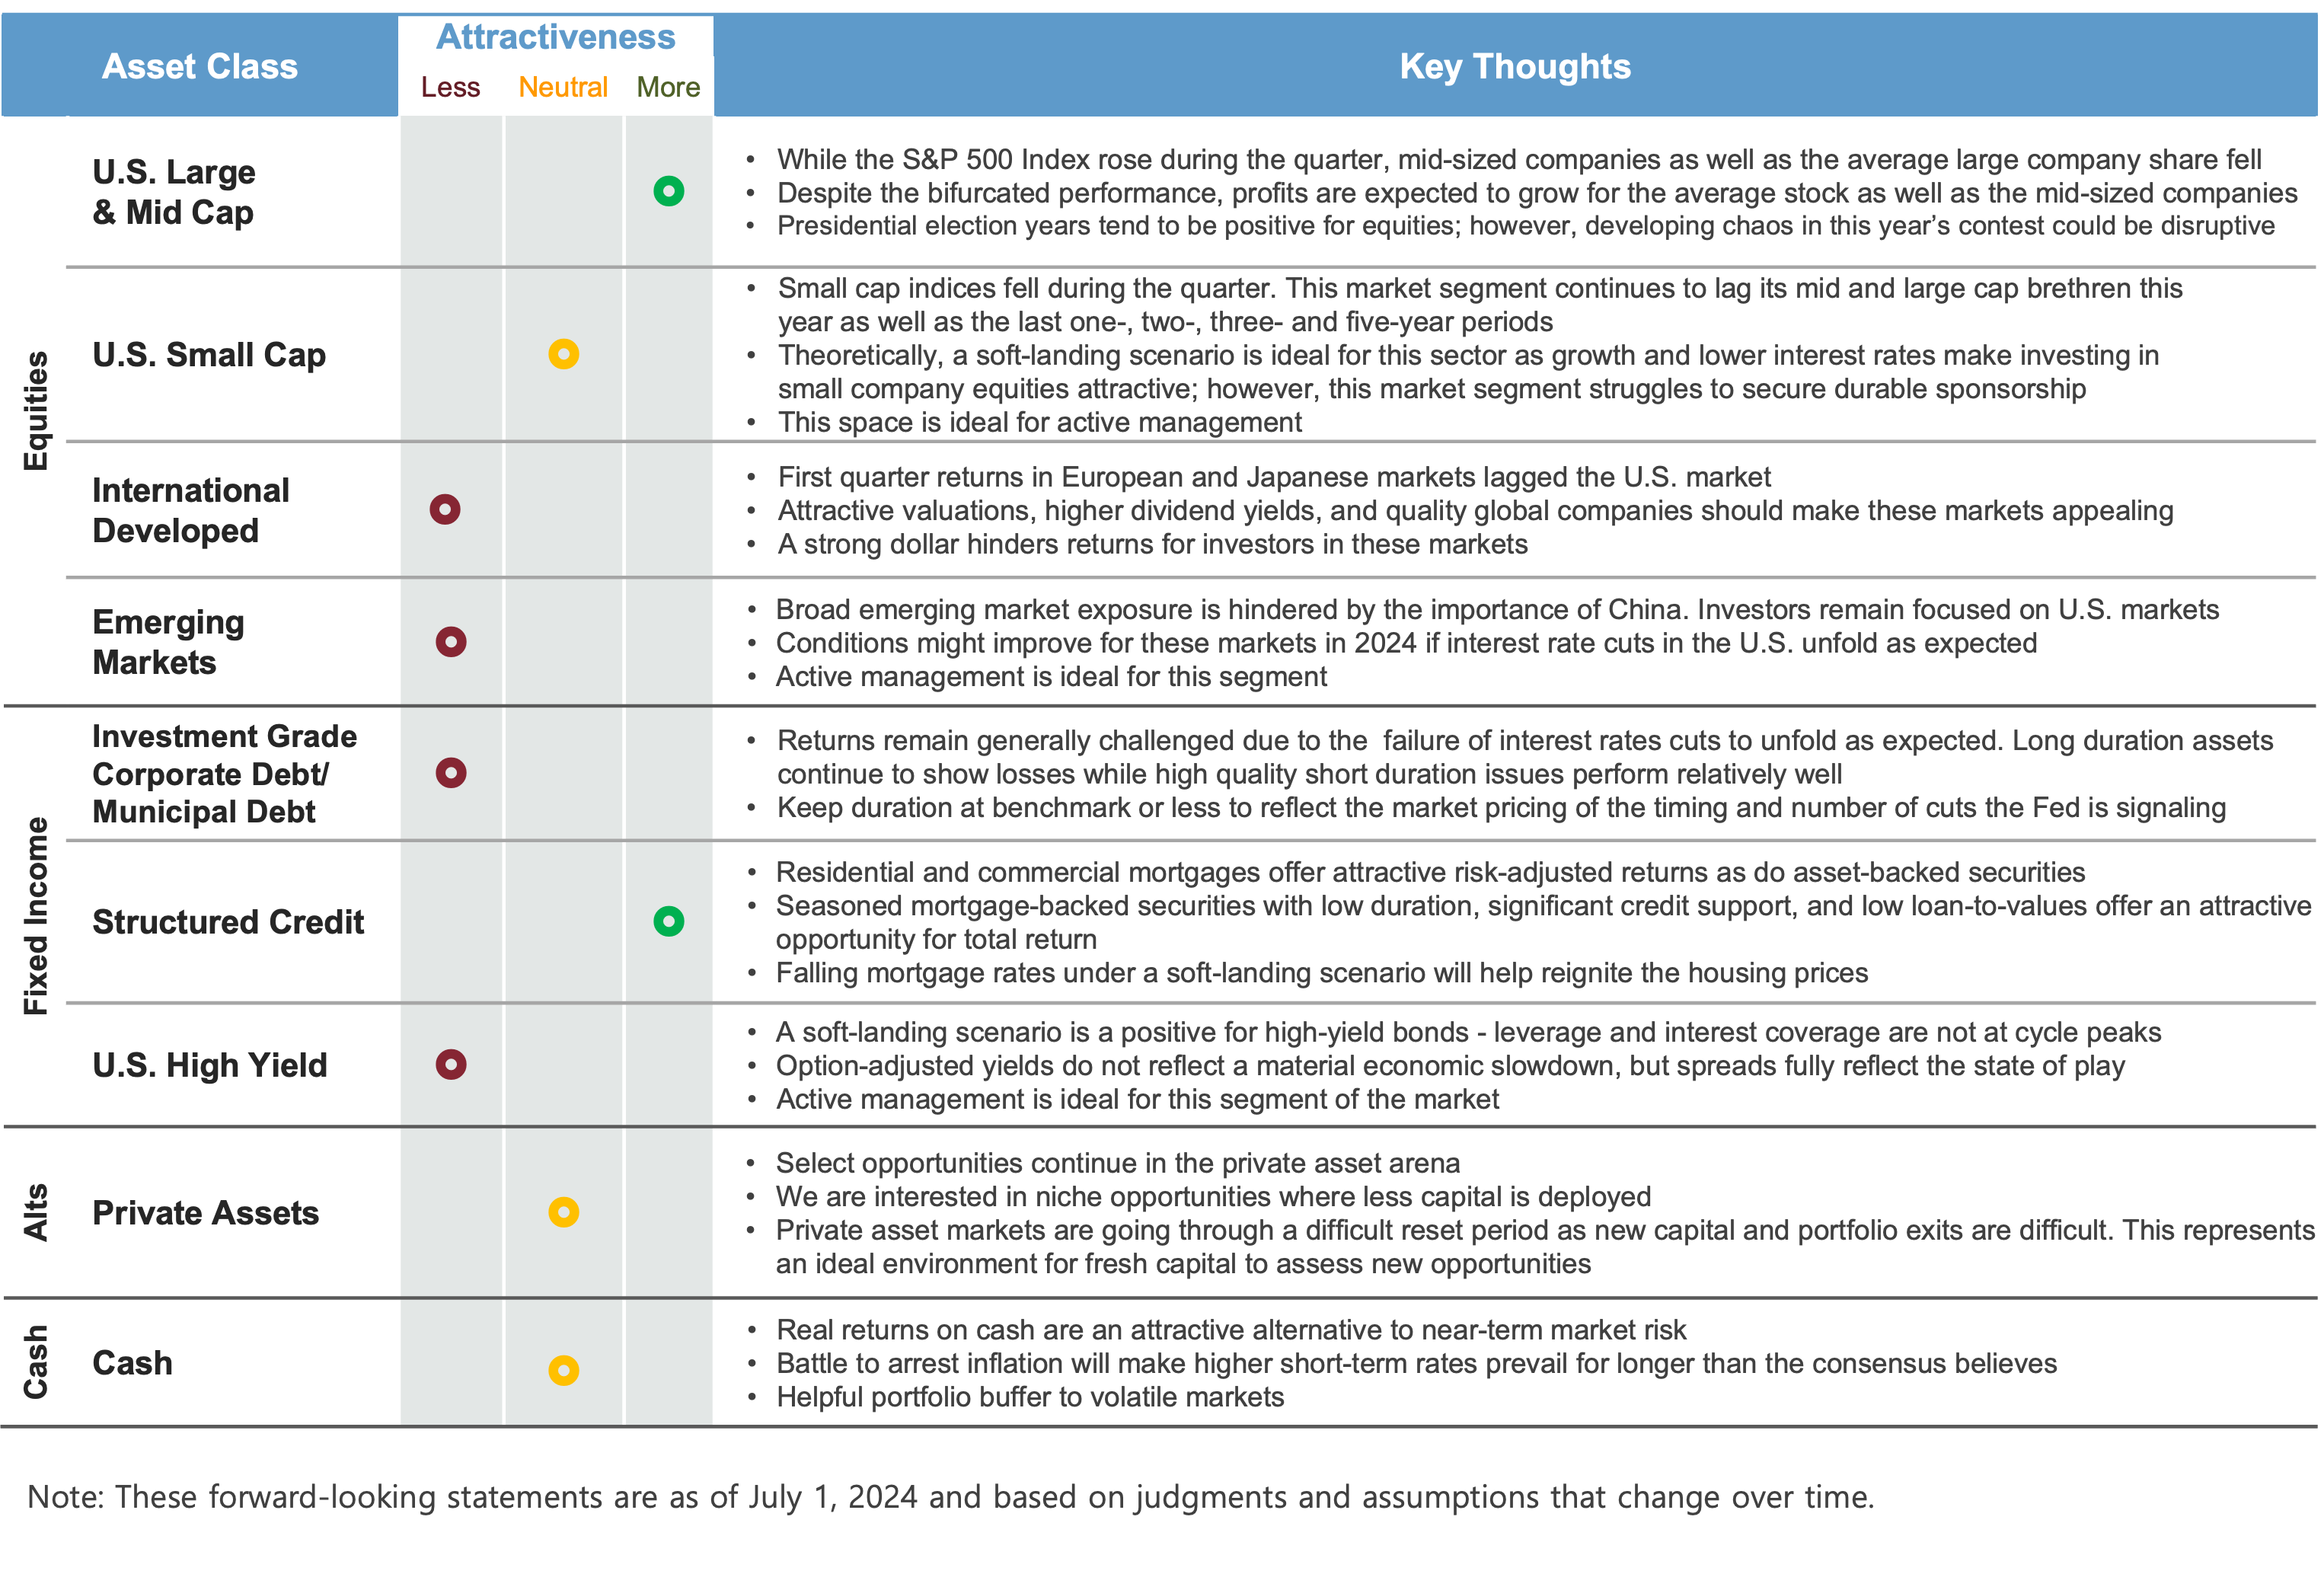
Exhibit E: Fiduciary Trust Asset Class Perspectives
